 by Gino D’Alessio
 by Gino D’Alessio
What is a Stochastic Oscillator?
 The Stochastic Oscillator is a commonly used technical indicator that attempts to determine the momentum of the price. As momentum changes we get indications of the next likely direction. This indicator is range bound, between 0 and 100. Therefore it also helps in identifying overbought or oversold levels.
The stochastic oscillator has been around for decades, which in my opinion also says a lot about its validity. George Lane developed this indicator in the late 1950s by comparing the latest close to a high-low range over a set number of periods. He realised that momentum changes before price direction does, so by comparing rates of change you can gain insight into the overall direction.
The chart below shows what the indicator looks like in the bottom half of the window. At first glance it would seem to follow fairly closely price movements. A complete understanding and knowledge of how to read these lines can greatly help in assessing price action however. As always, this indicator works best when used in conjunction with other indicators, which help confirm our ideas.

How is the oscillator calculated?
It’s not at all necessary to learn the formula for this calculation as modern software can calculate it for us very quickly and efficiently. However, understanding the formula behind the indicator helps us understand what we are looking at and how the indicator is attempting to predict price movements.
As we can see above the oscillator is constructed with two lines, the first one known as %K, takes the current close for any time-period, weeks, days, or hours, etc. and considering a look-back period of x periods performs the calculation shown as shown below.
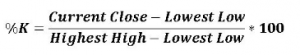
The lowest low over the look-back period is subtracted from the current close which is then divided by the highest high minus the lowest low over the same look-back period. The result is then multiplied by 100 to move the decimal point 2 places.
The next line, known as %D is a simple Moving Average of the %K over x periods. The most common periods for %K and %D are 14 and 3 respectively, whether the periods are days or minutes. However, I find that each market has its most appropriate periods depending on the time frame. What works very well on a day chart may not work as well on a 1-minute chart.
There may also be periods that work best in certain markets rather than others, it’s best, I find, to fiddle around with these two numbers to see the most consistent fit. I also tend to go for Fibonacci numbers as they have a tendency to pop up in nature consistently and have proven very useful in technical analysis too.
The %D then is the simple moving average of the %K line and is used as a trigger line. The calculation of this line is straight forward. Considering a number of periods the %K numbers are added and then divided by the number of periods to give the simple average over that period.
So what does the stochastic tell me?
Let’s suppose, the highest high of the look-back period was 1.10000 and the lowest low 1.09000, with a close of 1.09800, looking at the formula above for %K we would have a numerator of 0.008, while the denominator would be 0.01. Their division would give the result of 0.80, multiplying by 100 gives us 80, which is the type of number we would see on the chart.
The latest close then is at the 80% level of the range between highest high and highest low for the look-back period. A number above 80% indicates it is very close to the highest level for the period, while a number below 20% indicates price is very close to its lowest level.
When the %K line is above the %D, momentum of price is increasing to the upside. Caution must be applied though, as you may be in overbought territory when the indicator is close to 100. Vice versa, when the %K line is below the %D price momentum is decreasing, and the price should tend to fall. If the indicator is close to zero, then we may be entering an oversold area.
Read Part 2 of our Stochastic guide, where we explain how to use Stochastics.