Reversal patterns and technical indicators are two great tools for finding profitable trading opportunities. Combined, they unlock their full potential. This article explains how you can use technical indicators to make the most of your reversal pattern trading with binary options.
- What Are Reversal Patterns?
- Combining Reversal Patterns And Technical Indicators
- How To Trade Reversal Patterns
With this information, you will be able to use technical indicators to support your reversal pattern trading with binary options.
What Are Reversal Patterns?
As the name indicates, reversal patterns are significant price formations that indicate an impending market reversal. The right technical indicators can aid you in trading reversal patterns, unlocking many more trading opportunities for each reversal pattern and helping you to better trade the more well-known opportunities.
There are three main reversal patterns you have to know:
1. The Head And Shoulders Formation
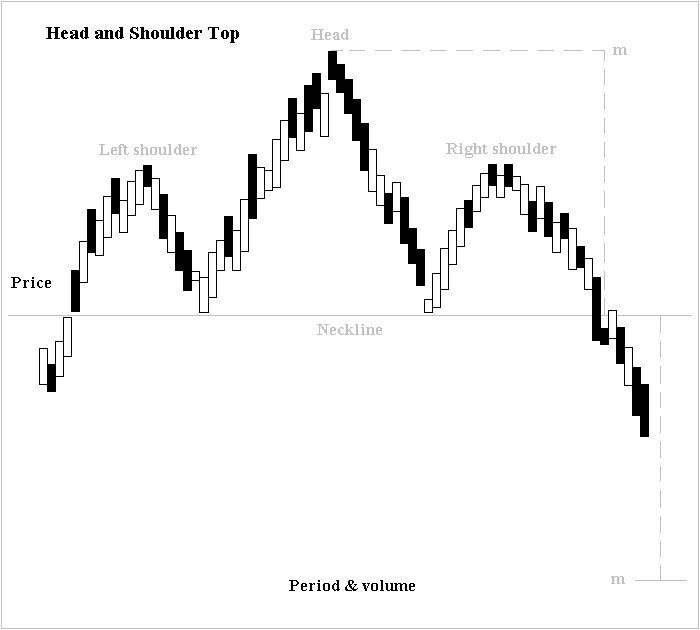
The market is in a trend and reverses. The head and shoulder can both represent an ending uptrend and a beginning downtrend or an ending downtrend and a beginning uptrend. In the picture, you see the top reversal with an ending uptrend. For the bottom reversal, just flip the picture on its head.
2. The Triple Top And The Triple Bottom
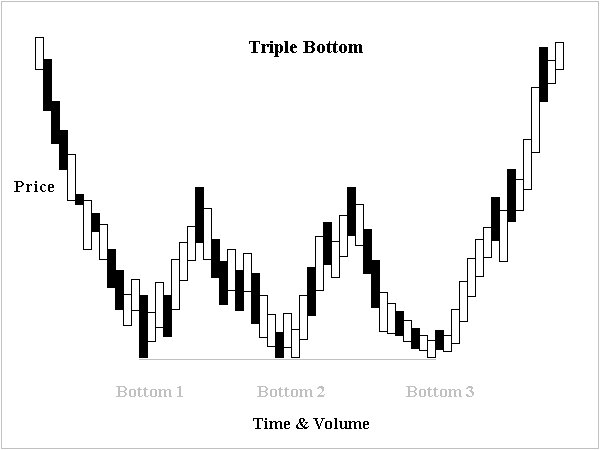
The triple top or bottom is a head and shoulders formation with two shoulders that are closer to the extreme. In the picture, you see a triple bottom that indicates and ending downtrend and a beginning uptrend. The triple top is the same thing flipped on the head.
3. The Double Top And The Double Bottom
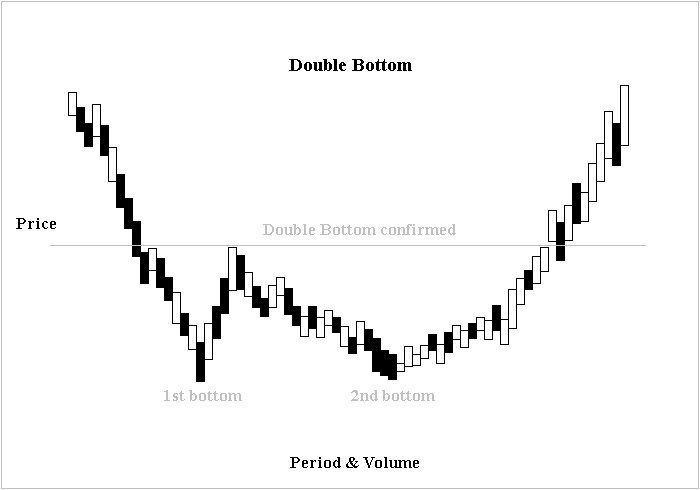
The double bottom and the double top look very similar to the triple bottom and the triple top. The main difference is that the market forms only two bottoms/tops, and reverses only once between those bottoms.
The beginning of the double top/bottom is the same as with the triple formations. The market creates an extreme and reverses briefly. After that, the patterns are slightly different.
- In a double top/bottom, the market takes longer to form the second bottom. The movement there is erratic and often shows a significantly lower volume. You can see this difference in the picture, where the market seems to stutter its way to the second bottom.
- In a triple top/bottom, the movement to the second extreme is straighter. While its volume is already lower than during the preceding trend, it is higher than in a double formation.
Often, the movement to the second extreme helps you distinguish between the double and the triple formations. We will soon analyse how technical indicators can help you with this important task.
The double formation completes when the market breaks through the price level of the previous reversal. At this point, a new trend will likely start in the direction of the preceding trend.
Combining Reversal Patterns With Technical Indicators
As you can see with the double formations and the triple formations, reversal patterns are often difficult to distinguish by pattern analysis alone. Only when they are complete, it is easy to see which reversal pattern you are dealing with. Technical indicators can help you to earlier recognize reversal patterns and more accurately define their boundaries
Put yourself in the shoes of a reversal pattern trader. When you think that the market will reverse, there are still many questions to answer. Questions such as:
- Which reversal will the market form?
- Will the market reverse after two highs/lows or will it create three high/lows?
- Will the market form a large reversal pattern or will the pattern be smaller and quicker?
Answering these questions is essential to winning a trade.
- When you think that the market is forming a double bottom, but it is really forming a triple bottom, you might invest too early.
- When you think that the market is forming a triple bottom, but it is really forming a double bottom, you might invest too late.
- When you think that the market is forming a triple top, but it is really forming a head and shoulders top, you will make all sorts of wrong predictions.
Accurately assessing the current market environment is essential to making the right predictions. Technical indicators are the ideal tool for this job. They can do three things for you:
- Technical indicators can help you understand when reversal patterns will form. Leading technical indicators help you understand when a trend is running out of momentum. In these market environments, a reversal will happen soon, which is why you know that you have to search for a reversal pattern. When you see the first signs of a reversal pattern, you know what is going on and can make the right investment decisions. Without technical indicators, you would be late to the party and miss out on great trading opportunities while maybe making bad decisions.
- Technical indicators can help you to find more trading opportunities in a reversal pattern. Understanding reversal patterns will help you recognize the general pattern. But this rough outline is insufficient for making an actual trade. When you know that the market is going through a reversal pattern, technical indicators help you understand how long each movement in this pattern will last. Therefore, you can determine the reach of each swing and trade all kinds of binary options based on this indication.
- Technical indicators can help you understand which reversal pattern you are dealing with. When you understand how far a swing will reach and when it will turn around, you can more easily distinguish the different forms of reversal patterns. When the market is nearing its second high during a bottom reversal, technical indicators can predict whether it will turn around soon and form a triple pattern or continue to rise and form a double bottom. You know what to expect and you can make better trades.
Combined, these three advantages provide you with a much better understanding of reversal patterns. By adding technical indicators, you can significantly improve your accuracy, your timing, and the number of trading opportunities that you find.
These advantages are so significant that every trader should consider adding at least one technical indicator to their trading of reversal patterns. Let’s take a look at how you can do that and which technical indicators can help you in which ways.
How To Trade Reversal Patterns
At this point, it is time to get concrete. We will now outline a few strategies for how to combine reversal patterns and technical indicators. The important point of these strategies is to show you the possibilities and the tools you can use. You do not have to copy these strategies exactly as we present them. Feel free to adapt them to your personal preference or include parts of them in your current strategy.
With that being said, let’s get started.
Strategy 1: Combining Reversal Patterns With The Money Flow Index (MFI)
The first technical indicator that we want to recommend combining with reversal patterns is the Money Flow Index (MFI).
The MFI is simple to understand. It multiplies the price movement of each period with its volume and then compares the sum of periods with rising prices to the sum of periods with falling periods. It presents the result as a percentage value between 0 and 100.
- A value of 0 indicates that all the money has been flowing out of the asset.
- A value of 100 indicates that all the money has been flowing into the asset.
- A value of 66 indicates that two-thirds of the money has been flowing into the asset, and one-third out of it.
You can interpret the MFI in two ways:
- Extreme areas. The MFI has two extreme areas: values over are considered overbought, values under 30 are considered oversold. In both cases, the MFI predicts that the market will soon turn around.
- Failure swings. In an intact trend, the MFI mirrors the market’s movements. As an uptrend climbs higher and higher, the MFI should climb, too. As a downtrend falls lower and lower, the MFI should fall, too. A failure swing happens when the market creates a new extreme without the MFI creating a new extreme, too. This sign indicates that the current trend is running out of momentum and that a reversal will happen soon.
Both of the MFI’s indications are ideal for trading reversal patterns. Here is what you do:
- Wait for the MFI to indicate a reversal. Depending on your preference, you can use extreme areas or failure swings. We recommend waiting for the MFI to enter an extreme area and then start scanning the market for a reversal pattern. When you find a failure swing, there is a good chance that the reversal pattern has already begun.
- Find the reversal pattern. Once the MFI has indicated that the market will reverse soon, it is time to start searching for the reversal pattern. Use pattern analysis and focus on price action. As soon as you have identified the beginning reversal pattern, continue with the next step.
- Identify the reversal pattern. Additionally, use the MFI to identify weakening movements. Switch to a shorter chart period and try to understand when the movements in the longer chart period will end. This way, you can understand whether the pattern will end after two extremes or three swings. If the second retracement begins to weaken as it reaches the price level of the first reversal, you know that the market will likely turn around and create a pattern with three extremes. If the second reversal shows no signs of weakening, you are likely dealing with a double bottom or a double top.
- Trade the pattern itself. Once you have identified the reversal pattern, you can use the MFI to predict impending reversals and more accurately pinpoint the boundaries of the pattern. You know the rough estimate for how far each swing will move. Use the MFI to monitor the strength of the swings as you trade them. If a swing is still strong, predict that the swing will continue. If a swing is beginning to weaken, wait until it indicates a clear reversal, and then invest in the opposite direction. Knowing the strength of each single swing helps you trade binary options types with a higher payout, for example one touch options and ladder options.
- Trade the prediction of the pattern. Once the pattern is complete, you can invest in the new trend that just started. You can use the MFI to confirm this trend. When the reversal pattern completes, the MFI should show no indication of a weakening trend. If the MFI still has enough room to rise and has not yet created a failure swing, predict that the new trend will continue. The exact details of the MFI can help you understand the strength of the current trend and whether you can trade it with a binary options type with high payouts or should play it safe and use high/low options.
In short, you can use the MFI to confirm and evaluate every part of the reversal pattern. You start by finding the market environments in which reversal patterns develop. You continue by using the MFI to time your investments, and you finish by using the MFI to confirm the reversal pattern’s main prediction.
Strategy 2: Combining Reversal Patterns With Moving Averages
The second technical indicator that can help you make the most of reversal patterns is the moving average.
Moving averages calculate the average price of the last periods and draw it into your price chart. For example, when you use a 20-period moving average, the moving average calculates the average price of the last 20 periods and draws it into your chart.
After that, the moving average goes back one period and repeats the process from the perspective of this period. This way, the moving average works its way through your price chart, always calculating the average price for the last 20 periods from the vantage point of each period.
The result of this process is a line. This line can tell you a lot about the market:
- Direction of the moving average line. If the moving average is pointing upwards, the market must be rising. If the moving average is pointing downwards, the market must be falling. When the moving average changes direction, it indicates a change in market sentiment.
- Line in relation to the current market price. If the market is above the moving average, it must have gained upwards momentum in the recent past. If the market is below the moving average, it must have lost momentum. When the market breaks through the moving average, it indicates a changing market environment.
- The moving average as a resistance/support line. The market is always reluctant to break through a moving average. When the market is above the moving average, the moving average works as a support; when the market is below the moving average, the moving average works as a resistance.
These indications are especially strong with significant moving averages. Most traders use moving averages based on 5, 10, 20, 50, 100, or 200 periods, which is why these values work best for a moving average strategy.
Additionally, longer moving averages are more significant than shorter ones. The market will be very reluctant to break through a moving average based on 200 periods, but it will break through a 5-period moving average more willingly.
Similar to moving averages, many other price formations create resistance and support level. You can combine them in a similar way with moving averages.
Strategy 3: Combining Reversal Patterns With Bollinger Bands
Bollinger Bands are a technical indicator that is very similar to moving averages.
The basis of Bollinger bands is a moving average with 20 periods. This moving average creates the middle line of the Bollinger. It is surrounded by an upper and a lower line that are the results of adding and subtracting twice the value of the standard deviation.
Bollinger bands create three lines that surround the market. The upper and the lower line create boundaries which the market is highly unlikely to leave, the middle line works as an additional resistance or support line, depending on whether the market is trading above or below the line.
When you expect that the market is forming a reversal pattern, Bollinger bands can give you a good idea of the rough outline of the pattern.
For example, that the market was in an uptrend that you expect to end. Here’s what you do:
- Use Bollinger bands to identify market environments in which reversal patterns are likely to form. Switch to a time frame that is longer than the time frame that you want to trade. For example, if you want to trade a chart period of 5 minutes, it would make sense to switch to a 1-hour chart. Wait until the market nears the upper range of the Bollinger bands or approaches the middle Bollinger band from below. In both cases, the market is likely to reverse, which, in turn, is likely to create a reversal pattern on a shorter chart period. Once you have found the situation, switch to the shorter chart period.
- Wait until the market trades at the upper range of the Bollinger bands on the shorter period. For an uptrend to have enough room to create a reversal pattern, it has to trade at the upper range of the Bollinger bands. Wait until the market gets there. On the way, you might be able to trade a few binary options that predict this movement, including some that make use of the Bollinger Band’s clear price target to trade an option type with a higher payout such as one touch options.
- Use the Bollinger bands clear price targets to make additional trades. When you know that the market will reverse, you need to predict how far each swing in the reversal pattern can reach. Bollinger bands provide you with clear indications for this task. The market can either reverse to the middle Bollinger band or the lower Bollinger band. The middle Bollinger band is the safer bet, but the lower band can also make sense as a price target if the trend created large reversals before. Use these targets to trade additional binary options.
The key to successfully executing this strategy is choosing the right chart period for your expiry. Bollinger bands change as the moving average and the standard deviation change, which is why you should trade them with an expiry that is close to the period of your chart.
For example, in a 5-minute chart, it would be a bad idea to trade Bollinger bands with an expiry of 2 hours. Until then, the market will have created so many new periods that the Bollinger bands will have changed completely. The predictions from two hours ago are now meaningless.
In this example, it would be better to use an expiry of 15 minutes.
Conclusion
Technical indicators can greatly benefit your trading of reversal patterns. They help you identify market environments in which reversal patterns are likely to form, identify the right reversal pattern, and find additional investment opportunities during the reversal pattern. Combined, these advantages are the reason why every binary options trader should consider adding at least one technical indicator to their reversal pattern strategy.