The relative strength index (RSI) is an easy-to-use technical indicator that makes trading binary options simple and fast. Newcomers especially can profit from the RSIs clear predictions. If you want to create a binary options strategy that keeps things simple by relying on a simple indicator, the RSI is your best choice. If you want to combine multiple indicators, it is always a good idea to add the RSI to the mix.
In this article you will learn:
- What Is The Relative Strength Index?
- How To Interpret The RSI
- How Can You Trade The Relative Strength Index (RSI) With Binaries?
- Final Thoughts On Trading RSI
So let’s get started.
What Is The Relative Strength Index?
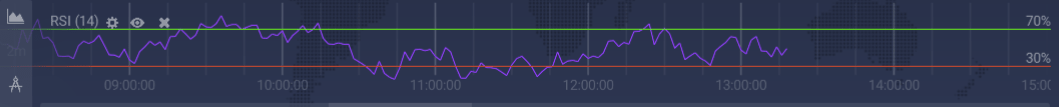
Technical indicators predict future price movements of an asset by aggregating past movements, calculating a specific value, and displaying the result in a simple-to-understand way. In the case of the RSI, this is a value between 0 and 100 that is drawn into a separate window, usually below your price.
Depending on whether the RSI is closer to the upper or lower end of its range and how its past movements relate to the asset’s price movements, you can predict what will happen next.
All you need for this prediction is a quick look at the value and a short comparison of the RSI line and the price line. You can do all of this in 5 seconds less, which is why the RSI is such an attractive tool for binary options traders.
In the fast-paced world of digital options, it is difficult to find a tool that helps you make a quicker decision about whether you should invest in an asset.
The RSI can be your guide to ultra-quick trading decisions.
How To Interpret The RSI
The RSI provides traders with two indications:
- Its reading
- Its past movements in relation to the market’s movements.
Let’s look at both indications individually.
What Does The RSI’s Reading Indicate?
The RSI’s reading indicates the relationship between upwards and downwards movements in the past. Most traders use an RSI based on the last 14 periods. For each of these periods, the RSI calculates the difference between the period’s opening and closing price. It adds up the values of all periods of rising prices and divides the results by the added value
Sounds complicated? Don’t worry. It is rather simple:
- If the last 14 periods all featured rising prices, the RSI has a value of 100.
- If the last 14 periods all featured falling prices, the RSI has a value of 0.
- If the market rose just as much as it fell over the last 14 periods, the RSI has a value of 50.
Learn these three values, and you know what an asset is doing at a glance.
Momentum Strength
But the RSI can do even more for you. It can help you judge the strength of a movement. You already know that values over 50 indicate rising prices and values below 50 indicate falling prices. Now consider the implications of the distance between the RSI’s current value and the 50 line:
- If the market rose more than it fell over the last 14 periods, the RSI has a value of more than 50. The higher the value, the higher the surplus of rising prices.
- If the market fell more than it rose over the last 14 periods, the RSI has a value of less than 50. The lower the value, the higher the surplus of falling prices.
Bottom line: the closer the market gets to 100 or 0, the stronger the movement.
- If the RSI reading increased and this increase accelerated, you know that the market is moving upwards and that the movement is gaining strength.
- If the RSI reading increased and this increase decelerated, you know that the market is moving upwards and that the movement is getting weaker.
Finally, there are the overbought and oversold lines. These lines are based on a simple logic: a stock’s price direction is solely determined by supply and demand. When there are more buyers than sellers, the prices goes up; when there are more sellers than buyers, the price goes down. But what if everyone has already bought or sold?
Market Forces
Assume that there is a perfect stock. It is so perfect that everyone in the world has invested as much money in it as they can. Now, even if the company is doing well, the only way for the stock is down. There is nobody left to buy the stock. Even if a single person sells it, the price will fall. Because there are so many more people who already have the stock than people who could want it, the only possible outcome is a long downtrend – regardless of how well the company is doing.
The RSI can help you to profit from such situations. Most traders use the values of 70 (overbought) and 30 (oversold), some also use 25 and 75 or 20 and 80.
When the market moves above the upper boundary, they consider the market overbought. Too many traders have bought the asset in the recent past, which means that supply will likely outweigh demand and the price will fall.
When the market moves below the lower boundary, they consider the market oversold. Too many traders have sold the asset in the recent past, which means that demand will likely outweigh supply and the price will rise.
With these indications, the RSI can tell you a lot about what is going on in the market.
What Do The RSI’s Past Movements Indicate?
The second way in which traders use to RSI is to compare it to the current market trend. When an asset is trending, it develops continuously higher highs and lows (in an uptrend) or continuously lower highs and lows (in a downtrend). These zig-zag movements are great trading opportunities because they can continue for a long time, which makes predictions easy.
In a trustworthy trend, the RSI mirrors the market’s movements:
- In an uptrend: If the market is creating a new high, the RSI should be creating a new high, too.
- In a downtrend: If the market is creating a new low, the RSI should be creating a new low, too.
If the market creates a new high (in an uptrend) or low (in a downtrend), but the RSI fails to mirror this move, traders speak of a failure swing.
Failure swings are strong signs that a trend is losing momentum and might end soon. Apparently, the market is no longer moving as quickly as before; the momentum that pushed the asset in a strong direction is gone. Now, the trend will likely end, and the market will turn around.
These are the two most popular ways of interpreting the RSI. Now let’s look at how you can turn them into profitable binary options trades.
How To Trade The Relative Strength Index (RSI)
Binary options allow you to trade the RSI with several strategies. They differ in risk, time requirement, and the number of created signals. Let’s look at each strategy individually.
Trading Oversold And Overbought Indicators
When the market reaches the oversold or overbought regions of the RSI, something is going on. Unfortunately, it can be difficult to pinpoint what exactly this something is.
When the market reaches the overbought/oversold area, the RSI predicts that it will turn around soon. During solid trends, however, the market often stays in the overbought/oversold area for quite some time. You should be careful before you blindly invest in a turnaround once the market reaches an extreme area.
Instead, try to understand what is going on instead and act accordingly. You have these options:
- Invest right away: Long lasting trends are especially common on long time frames – when you look at charts that display the price movements of a full year or more, for example. On the short time frames that you trade with binary options, market movements are erratic and long-lasting trends rare. If you think that your asset is unlikely to develop a long trend, you can throw caution to the wind and invest right away. You should use a high/low option and choose a little bit longer expiry. Give the market enough time to turn around. Once it does, you will win your option, so it’s better to invest a little longer than shorter.
- Wait for a second signal: Some traders want the market to confirm its first signal. Once the RSI enters the overbought/oversold are, they wait until it leaves the area again. Now, the trend is over, and they can invest. In this case, the market has already moved in its new direction, which is why you should keep your expiry shorter.
Regardless of when you invest, this type of strategy will create many signals for you. It has a high potential – many trades can mean high earnings – but it also bears more risk. Start slow and increase the pace as you feel more and more comfortable.
Trading The RSI’s Direction And Momentum
The RSI’s direction tells you whether the market is rising or falling, the RSI’s speed tells you whether the movement is gaining or losing strength. This is all you need to invest.
- When the RSI is moving upwards and accelerating, you know that there is a strong upwards movement and a good chance of winning a high option.
- When the RSI is moving downwards and accelerating, you know that there is a strong downwards movement and a good chance of winning a low option.
Risks
The risk of this strategy depends on how you interpret the RSI’s direction. If the RSI has moved up for six periods and down for one, it is probably not yet moving downwards. Wait until there are enough periods to confirm the direction.
Additionally, some traders like only to trade the RSI’s upwards movements when they start below the 50 mark and downwards movements when they start above the 50 mark. Because the movement starts far away from the extreme value for its direction, this safety measure guarantees that there is enough room for a long movement to develop, which increases the chances of winning a binary option.
In any case, you should use a short to medium expiry. Since the market is currently moving in the right direction, there is no sense in waiting for things to change.
Trading Failure Swings
Probably the safest way of trading the RSI is trading failure swings. Failure swings only happen when something is very wrong with a trend, and they are a sure indication of a turnaround.
When you find a failure swing, invest in the opposite direction of the preceding trend:
- During an uptrend, invest in a low option.
- During a downtrend, invest in a high option.
Choose a long expiry. The market can go through a short sideways movement after a failure swing, and you want your expiry to be long enough to last until the market is going down. Once it is going down, it is likely to fall for some time, so it is better to err on the side of caution and choose a long expiry.
Final Thoughts On Trading RSI
The RSI works best when the market is in a trend. Some traders also use the RSI during sideways movements, but if you are new to the RSI, we recommend starting with trends.
If you want, you can combine the RSI with other indicators. Obviously, trend analysis would be a logic choice, but you can also mix in candlestick formations and moving averages.
The Relative Strength Index is easy to interpret, which makes it great for beginners. If you are just starting out and want to use the RSI, please avoid the mistake of only learning the RSI. There is so much going on in the market, and to truly trade well, you need to understand it.
Conclusion
The RSI is an easy-to-understand technical indicator that is especially great for newcomers.
You can trade the RSI by monitoring its overbought/oversold areas, its direction and momentum, and its movement in comparison to market movements.
We recommend trading the Relative Strength Index with high/low option and an expiry adjusted to your trading strategy.
Read More On Strategy.