Price action trading and binary options are inseparable. To become a successful binary options trader, you have to use price action analysis. At the same time, binary options are the most profitable way of trading price action predictions.
In this article, you will learn:
- Why you need to understand price action for binary options
- How does price action trading work?
- Tools that can help you interpret price action
- Why should binary options traders use price action?
- Price action is a numbers game – act accordingly
With this information you will know everything you need to become a price action trader.
Why You Need To Understand Price Action
Price action trading is exactly what the name indicates: it is all about the actions of an asset’s price. Price action traders ignore everything about an asset except for what its price has done in the past.
Fundamental data, history, and gut feelings – none of these things matter. The same applies to whether a company is doing well or not, has increased its earnings or not, etc.
This approach might seem counterintuitive at first, but it makes perfect sense when you think about how the market works.
Supply And Demand
The price of an asset is solely determined by the relationship of supply and demand.
- When demand exceeds supply, the asset’s price will rise.
- When supply exceeds demand, the asset’s price will fall.
When more traders are buying than selling, the price goes up. It’s that simple.
Conventional traders assume that supply will exceed demand in the long run if a company, currency, etc. is doing well and that demand will exceed supply in the long run if a company, currency, etc. is in trouble.
Price Action Over Fundamentals
Many newcomers to binary options never question this assumption, which is a disaster. To understand why think of three of the many events that this theory is unable to explain:
- What happens today? Even if there were a direct, unbreakable connection between a company’s business and its stock price, how would this knowledge help you invest today? If you knew that stock A will be trading higher than today in three years, what does that say about the performance in the next hour or the next day? Even the best stock in the world has down days. For short-term trading long-term developments are meaningless. Price action can help you answer these questions.
- How far will an asset rise or fall if good or bad things happen? Again, let’s assume that there is a direct connection between an asset’s price and fundamental influences. Now assume that there is a positive surprise. You might predict that the asset’s price will rise, but how far would it rise? For how long? Fundamental analysis is unable to answer these questions; only price action can help you.
- Often the market falls in reaction to bad news. There have been many situations when the market has fallen in reaction to positive events and risen in reaction to negative events. Why? There is no logical connection between both events.
The problem with using fundamental factors to predict market movements is that these connections only work in hindsight. Once the TV analysts know that a stock fell today, they believe that it must have been because of a specific event. But on the morning of the same day, it would have been impossible to predict which of the many, many events of the day will influence the market the strongest and how this influence will unfold.
Market Timing
Additionally, it would have been impossible to predict when people will buy or sell. Not all market actions are perfectly rational and predictable. When a grandmother gives money to her grandson, and he decides to invest it in stocks, he will create demand and drive the price up, but there is no way of predicting such events.
Similarly, large investors such as banks and funds often buy or sell a stock over long periods of time. Because these institutions move so much money, buying or selling a stock all at once would catapult its price up or down and be unprofitable. Therefore, they buy or sell assets over long periods of time.
These times are impossible to predict with fundamental analysis – there is no way of knowing that a fund will shift its investments from Disney to Coca-Cola, for example – but they can be highly profitable because they drive the market for long periods of time.
To deal with these issues, traders started to focus on price action. Price action can make the seemingly random price movements of the day predictable, which is essential for binary options traders.
How Does Price Action Trading Work?
The premise of price action is simple: everything you need to know about an asset’s price is already included in it. From what happened in the past, you can conclude what happens next. It is unnecessary to ask why an asset’s price should rise or fall; it is enough to know that it will rise or fall. Price action ignores the factors driving the market and solely focuses on where they are driving it.
Price Action Happens Now
To understand this difference, think of a person that walks into a Starbucks. You might not know why this person walks in there, the person’s history, and everything affecting them today, but if you want to bet on the person’s reason, it would probably be best to assume that they want to get coffee.
Of course, they might just have to use the bathroom or want to talk to a friend, but if you bet that every person who goes into a Starbucks wants to get coffee, you would win a lot of your bets. This is the price action approach – simply by knowing what is happening now, you can predict what will happen next.
The entire thought process is simple and ignores the irrelevant. When you what a person does over the next 30 minutes; it is enough to know that they just walked in a Starbucks. Most likely, they will get coffee.
Fundamental Flaw
Fundamental investors, on the other hand, would try to find out everything about a person, their daily habits, and their taste. Then, they would try to predict where they will be. This approach is fine if you are unconcerned about time – you can predict that the coffee lover will get coffee at some point.
But if they are asleep right now, or sick, or on vacation, you might have to wait quite a while for this prediction to come true. Price action traders wait for the person to go to Starbucks and then predict that they will get coffee – a much more accurate way of predicting prices.
Adapted to financial markets, price action traders solely focus on price movements to predict what will happen next.
Tools That Can Help You Interpret Price Action
Drawing conclusions from a price might sound impossible to newcomers. But there are a few tools that simplify the task to pattern matching and understanding a few numbers:
Trends
One famous example of price action trading are trends. When the market rises or falls, it never moves in a straight line. Instead, it moves in a zig-zag line, always taking two steps forward and one step back. Trends often last for long periods of time, which allows price action traders to predict what will happen next. When they see a trend, they invest in the prediction that this trend will continue.
Technical Indicators
Price action traders use many technical indicators that display market movements in a way that makes predictions simpler. Moving averages, for example, calculate the average price of the last period and draw it into the price chart. They repeat the process going backward, which creates a line of all the past average prices. You can use this line to trade in a number of ways:
- General direction: When the moving average is pointing upwards, the market must be on the rise, and it makes sense to invest in rising prices.
- The market’s crossing the moving average: When the market crosses the moving average, it must have turned around recently. Traders invest in this turnaround, predicting that prices will continue to move in the opposite direction of the preceding movement.
- Two moving averages crossing each other: Many traders use two moving averages, a shorter and a longer one. For example, the longer moving average could analyse three to four times as much time as the shorter one. The shorter one would react to changes in market direction much quicker. When the shorter moving average crosses the longer upwards, this is a strong sign that the market must have turned upwards. Traders invest in the direction of the crossover.
Other Indicators
Other indicators are oscillators that create a value between 0 and 100. This value and its change over time help you to understand what is going on in the market and what will happen next. For example, you can understand whether trends and other movements still have energy left or will turn around soon.
Technical indicators such as these can interpret the price action for you. You can discover new layers to your analysis and make better decisions than you could if you would look at price movements alone.
Price Formations
Sometimes the price moves in ways that allow for especially good predictions. The most well-known price formation is the trend, but there are much more options:
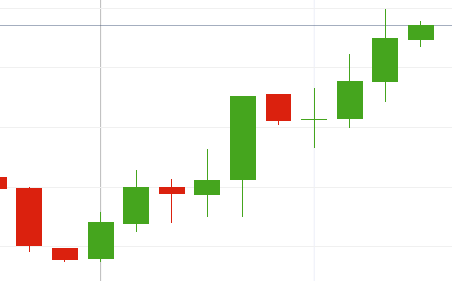
- Candlesticks: Candlesticks are an alternative to the conventional line charts you see in the newspaper or on TV. Candlestick charts provide more information than line charts because they can display every single price of an asset. Some candlesticks are characteristic of a strong movement; some indicate an impending turnaround. Learn these candlesticks, and you can predict what will happen next.
- Continuation and reversal patterns: Continuation and reversal patterns develop over long a long time. Continuation patterns indicate that a movement will continue after it took a brief break; reversal patterns indicate that a movement has turned around. Learn these patterns, and you can make sophisticated predictions that even allow you to trade highly profitable option types such as one touch options and ladder options.
- Resistance and support levels: Resistance and support levels are price levels that the market has been unable to break through. They become especially strong when the market has tested them a few times but always failed to break through. Somehow traders are no longer willing to buy or sell beyond this point. When the market approaches the same price level again, price action traders predict that it will once again fail to break through it.
Why Should Traders Use These Indicators?
For binary options traders, price action is the only viable technique to predict future market movements. Binary options are short-term investments whose ability to make 10 or more trades a day is the reason for their unmatched earning potential.
Traders of conventional assets such as stocks can get away with using fundamental analysis. They can simply sit and wait for their predictions to come true. This approach can work, but it is also the reason why they might only turn a profit of 10 percent over a period of two years and are still satisfied with the result.
Binary options have expiries of a few minutes to a few hours. This is why you can make a lot of money in a short time, but it is also why you have to use special methods. Price action is the only tool that can help you with this task.
Price Action Is A Numbers Game – Trade Accordingly
The important thing newcomers to binary options have to understand is that price action analysis never guarantees that something will happen. It merely states that certain outcomes are more likely than others. This approach implies that, sometimes, you will be wrong.
Let’s get back to our Starbucks example. If you predict that everyone who walks into a Starbucks buys coffee, you might win 90 percent of your bets.
Refine Strategy
For example, you would be wrong when an employee walks in. Now you can add another indicator, for example the type of clothes someone is wearing. You only predict that a person wants to get coffee when they are not dressed like a Starbucks employee. Nonetheless, you would lose your bet whenever an employee is wearing normal clothes and changes at the Cafe.
Since you would win the overwhelming majority of your trades, you can accept a few losses. Your gains will by far outweigh the little money your losing trades cost you. Still, this approach only works if you limit your investment.
Money Management
If you invest everything in a single trade, you will sooner or later lose such a trade and be bankrupt.
If you invest half of your money on every trade, losing a trade will hurt you much more than winning a trade will help you. With an account balance of $100, for example, you would fall to $50 after a losing trade and need two winning trades just to get back to where you were before. When you lose two or three trades in a row, you will have dug yourself a hole which is too deep to get out.
To avoid such a disaster, price action trading requires a solid money management. Money management is an important part of every form of financial investment, but for binary options traders, which can easily make ten or more trades a day, it is essential.
Conclusion
Price action is the only tool that can predict short-term market movements. For binary options traders, it is their lifeblood. Price action acknowledges that it is unimportant why something will happen, it is enough to know that it will happen. It ignores the reasons behind market movements, instead identifying the driving psychological factors behind certain patterns.
By understanding these patterns and investing in the predictions they allow, binary options traders can win short-term trades. To become a successful binary options trader, master price action analysis, and you will have a solid foundation.
To find the right broker for your binary options career, take a look at our top list of the best brokers available.