2017 should be an interesting year for the USDCAD. Here’s how you can take advantage of these developments with binary options.
What Will Happen To The USDCAD In 2017?
To understand what will likely happen to the USDCAD in 2017, consider this daily price chart.
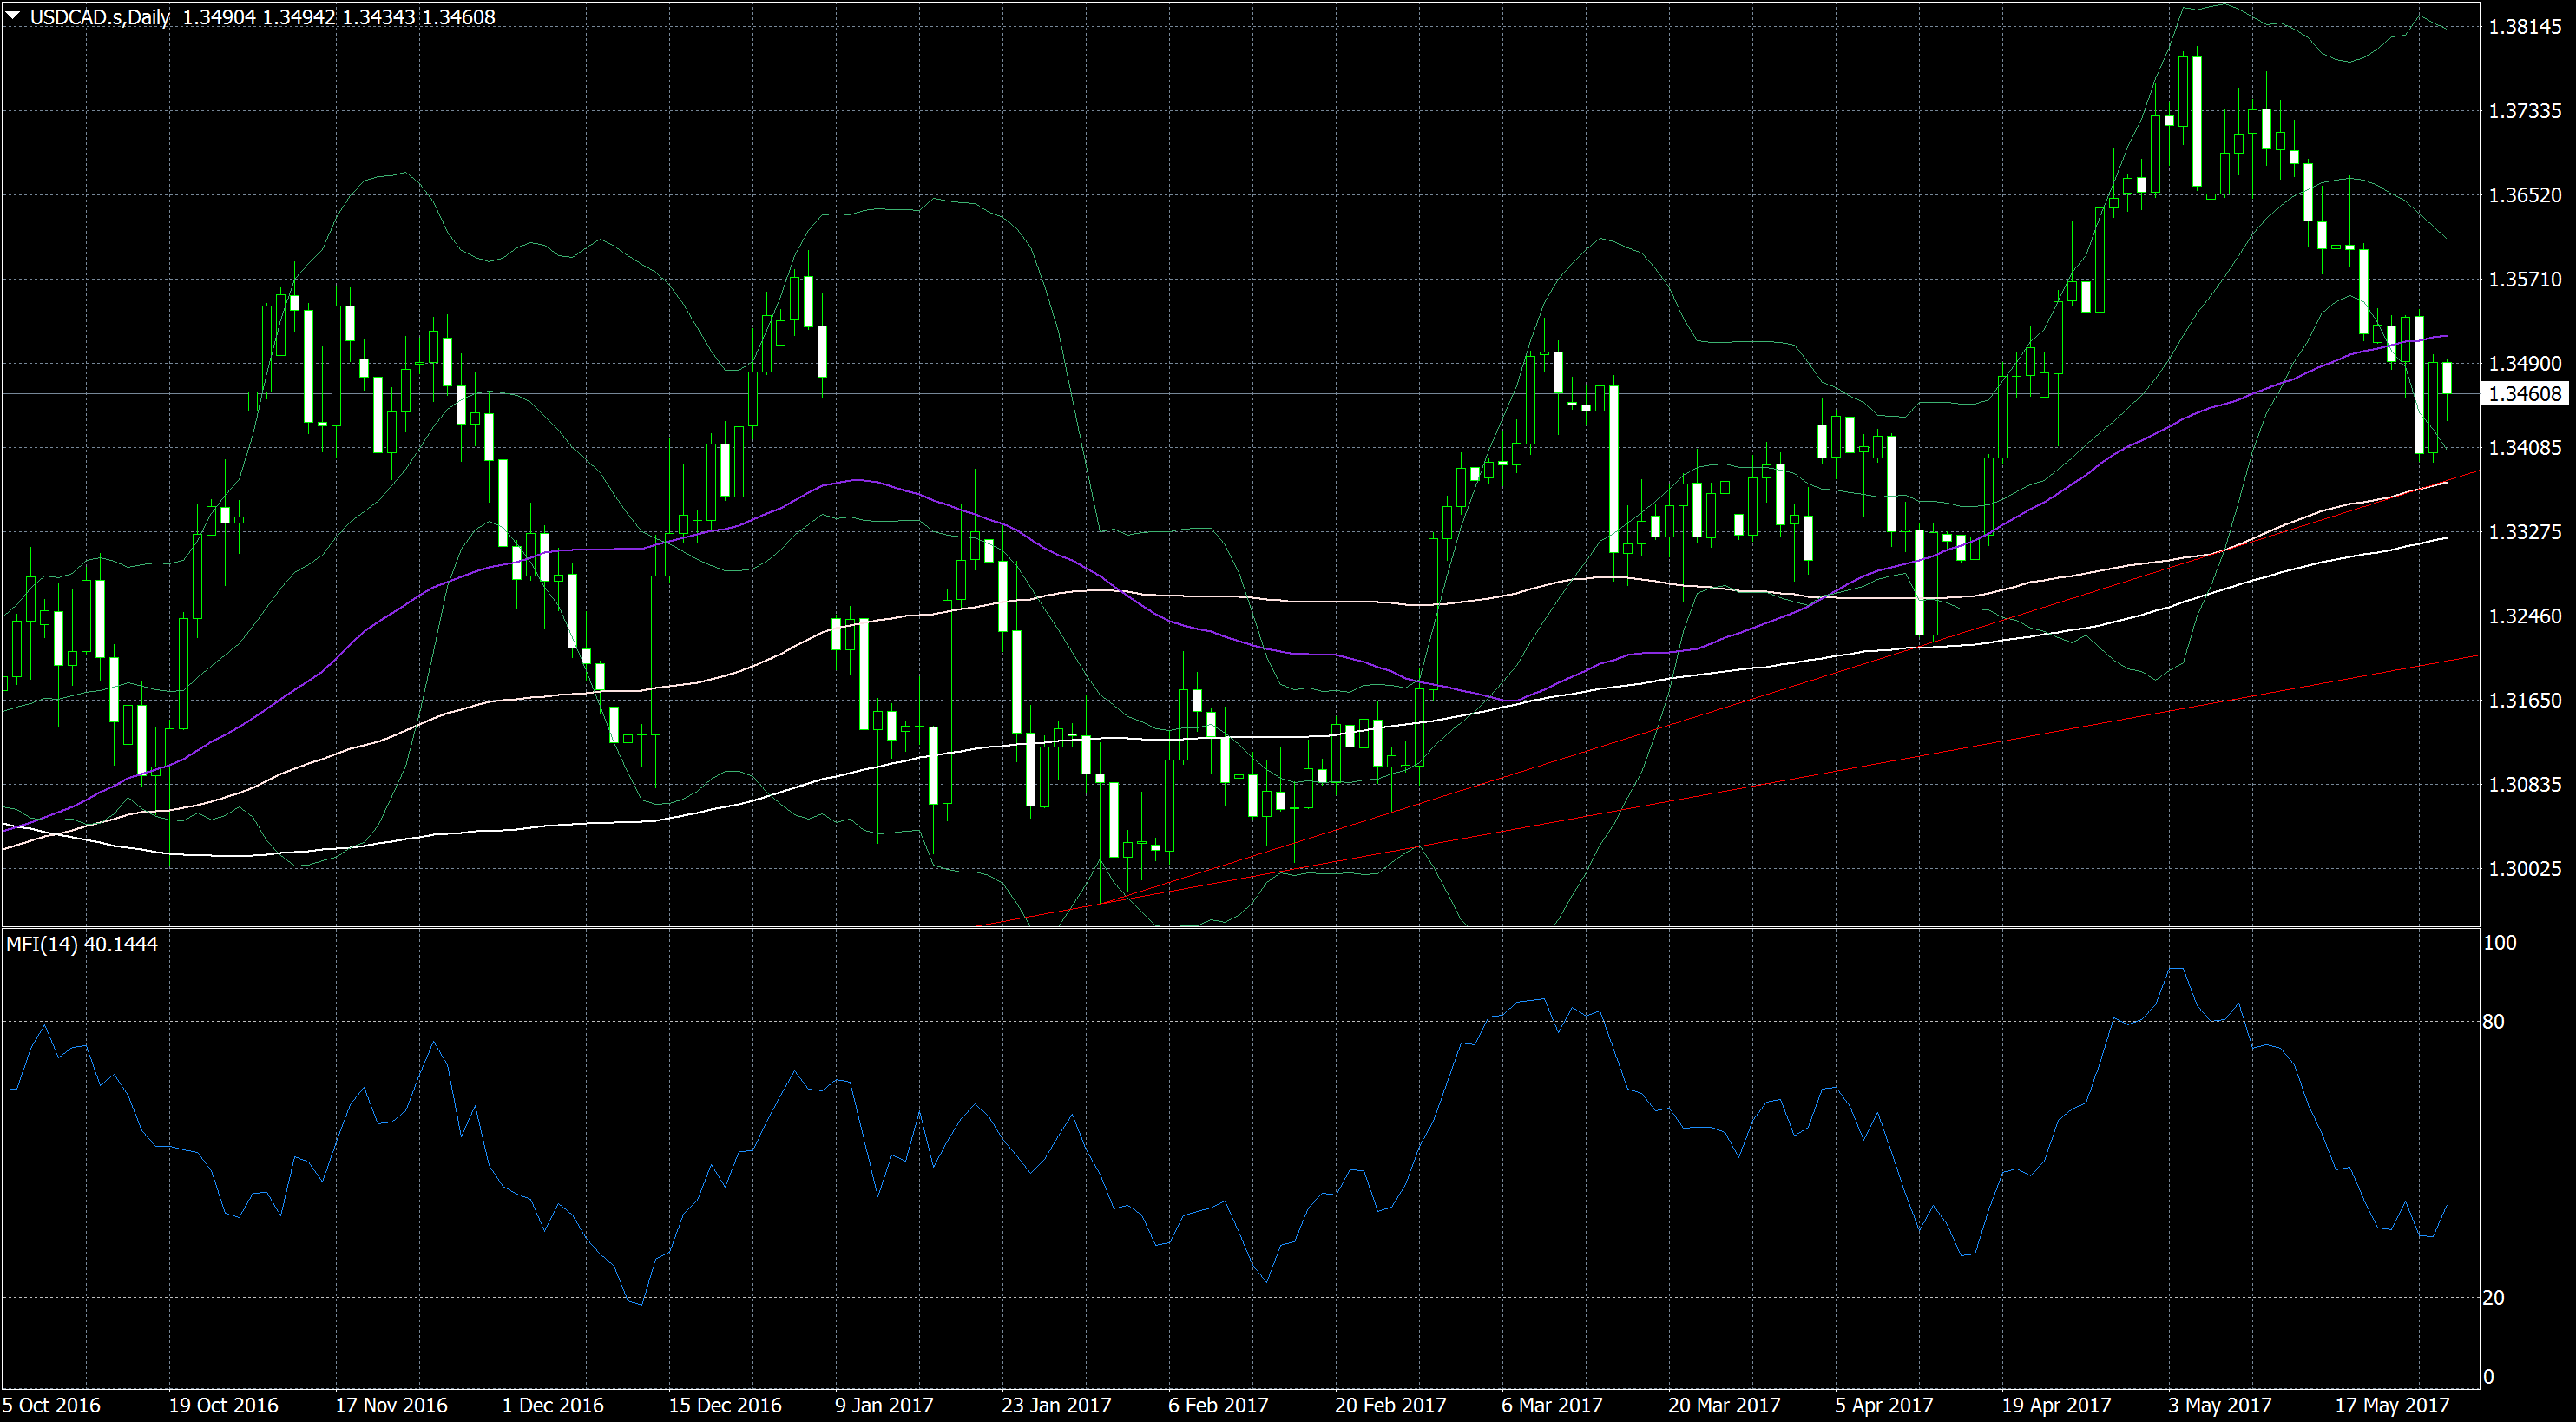
This price chart uses two trend lines, Bollinger bands, the Money Flow Index (MFI) and three moving averages (50 days, 100 days, and 200 days). It tells us a lot about the current market situation. Let’s work through all the information:
- The USDCAD is in a long-term uptrend. The long red trend line indicates the main market direction. The three moving averages further confirm the current upwards tendency. The shortest moving average is closer to the market than the medium moving average, which is closer than the slowest moving average.
- There are signs for a downwards momentum. The market has fallen in the recent past. It has crossed the shortest moving average downwards, which is a bearish sign.
We can conclude that the market is moving upwards in the long term, but it has entered a downwards movement. Therefore, the main question is how far this momentum will continue. Is it able to break the main trend or will the market turn around and move upwards again? If so, when will it happen?
USDCAD Key Points
Let’s answer these questions:
- The first test will be the next shorter trend line. The market has often left the long-term trend line to create shorter, steeper upwards trends. The red line to the right indicates the latest steep trend. The first test for the current downwards movement will be this trend line. The market should approach it within the next few days. Expect the downwards movement to encounter upwards support at this line, which will slow the movement down and create opportunities for high investments.
- The market has upwards potential. If the short trend line remains intact, the market will turn upwards again and has room to at least 1.39. Give the market a few days time to confirm this prediction. If it holds true, you can think about trading a long-term high option with an expiry around the end of the month. You have a good chance to win this trade. Short-term investors can expect a strong momentum if the market turns around. They should use momentum indicators such as the Average True Range (ATR)
- The MFI confirms the upwards momentum. The MFI reached a high during the market’s last high, which means that it did not create a failure swing. The MFI is in a solid uptrend and has reached the lower end of its trend channel, which means that a turnaround likely.
- Risky traders could invest in a long-term high option right away. The short-term trend line is at the same price as the 100-day moving average. Both create support, which means that the market will soon encounter a strong support level. Risky investors could use this as a sign that the market is at the lower end of its trading range and invest in a long-term high option that expires around the end of the month.
- If the market breaks the short-term trend line, expect volatility. If the short-term trend line fails to hold, the market gains a strong downwards momentum that is likely to take it to the long-term trend-line. On the way there, it encounters the 200-day moving average and has to fight the Bollinger bands, which create upwards support. These conflicting influences create an interesting dynamic that should result in a volatile, often changing market environment. Avoid too long expiries and consider trading boundary options, which profit from a high volatility.
With this preview, you should be well-prepared. Remember that these are only predictions and keep an eye on new developments.
If you still need a broker to trade these predictions, take a look at our broker list.