Over the coming weeks, the Dow Jones provides unique investment opportunities for binary options trades. This article will explain how you can take advantage of them with binary options.
What Will happen To The Dow Jones In 2017?
To understand what will happen to the Dow Jones, consider this price chart:
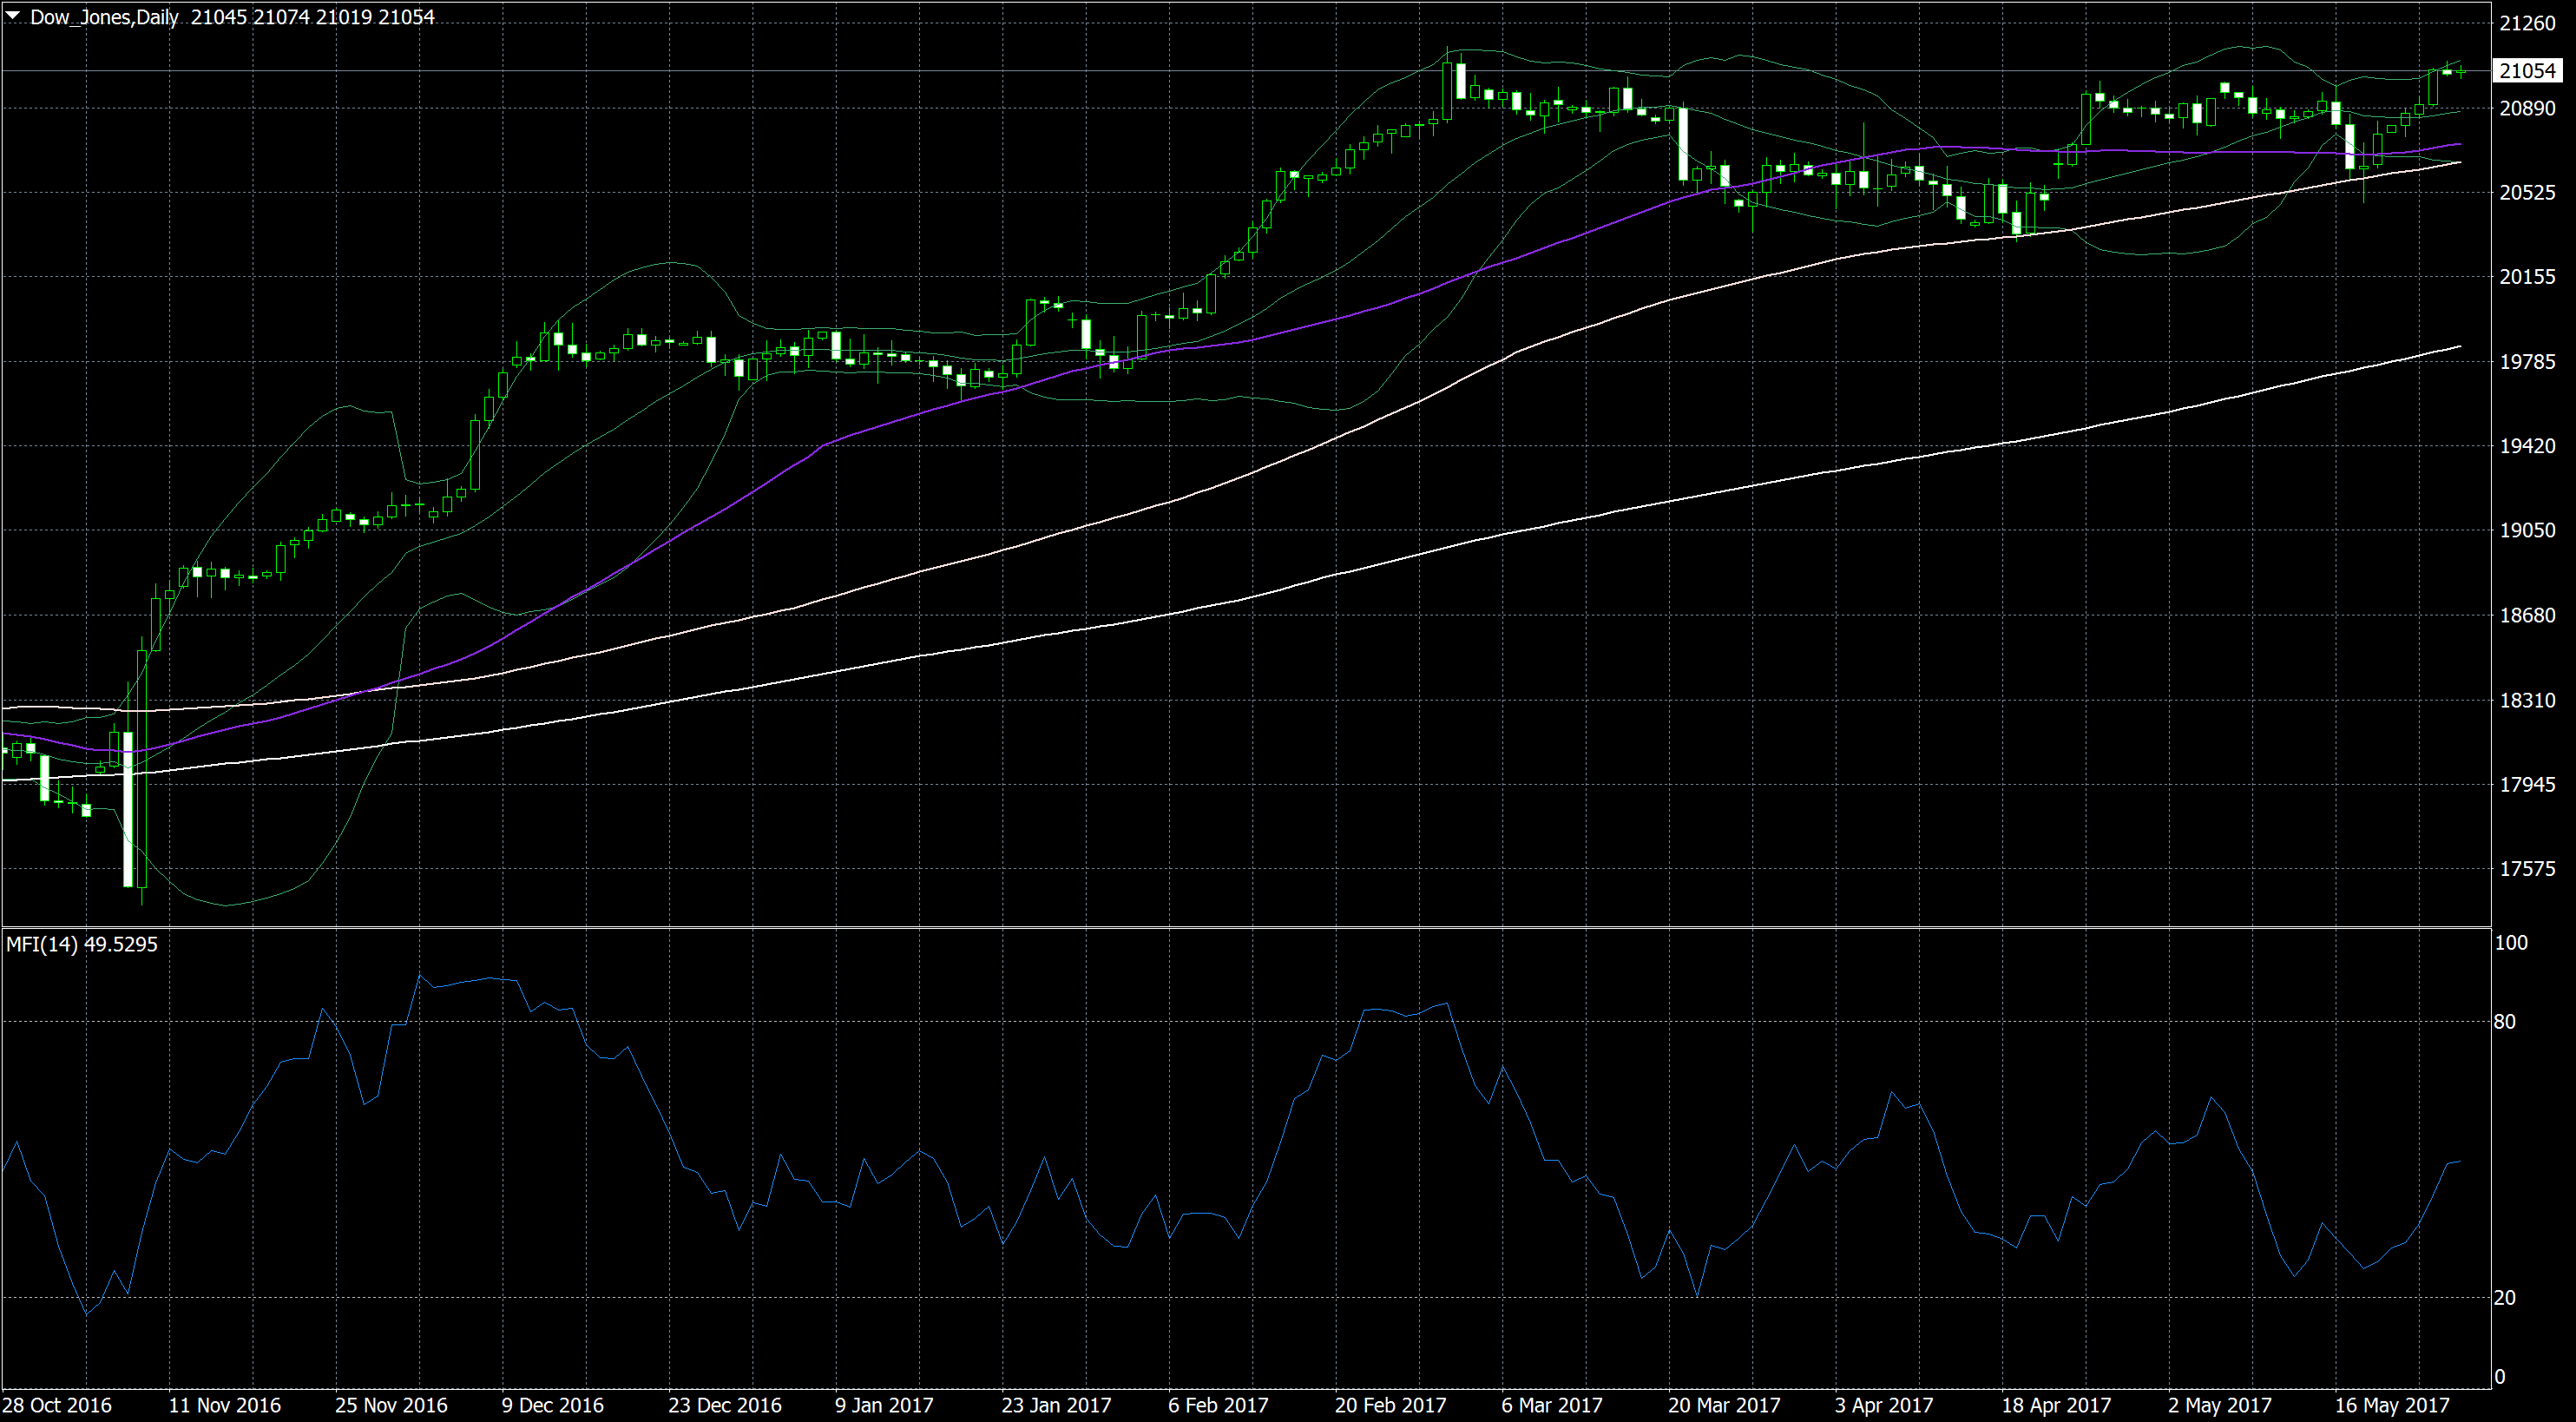
This is a daily chart of the Dow Jones with Bollinger bands and three moving averages (50 days, 100 days, and 200 days).
What Does This Chart Tell Us?
Well, let’s start with the three moving averages.
- The fastest moving average is above the medium moving average, which is above the slowest moving average. This is a strong sign of an intact upwards movement.
- The current market price is significantly above all three moving averages, which confirms the strong upwards tendency.
In the long-term, all signs point to rising prices. But what will happen in the short term? To answer this question, let’s take a look at the Bollinger bands.
- The market trades near the upper end of the Bollinger channel. This is a strong sign of an impending correction.
- The lower end of the Bollinger channel is at the same prince range as the 50-days and 100-days moving averages. This combination provides the market with a strong support level to the downside.
How Do We Put These Indications Together?
The most likely outcome is that the market will start to fall during the first part of the month. This reversal will stagnate when it reaches the middle Bollinger line but it will eventually continue to the lower end of the Bollinger channel and the two moving averages.
After a brief sideways movement at this price level, the market is highly likely to reverse and move upwards again. This movement will be stronger and straighter than the downwards movements.
This prediction remains valid until the 50-day moving average drops below the 100-day moving average or the market closes significantly below the moving averages and the Bollinger price channel.
How To Trade This Prediction With Digital Options
Binary options offer you great tools to take advantage of this prediction. Let’s look at a few examples:
- A long-term low option with an expiry of one or two weeks provides you with a high chance to win a trade with a payout of 70 to 75 percent. No other type of investment can rival this mix of security and profitability.
- Ladder options provide you with a wealth of possibilities. You can predict that the market will not rise above the Bollinger band, or that it will fall to the middle Bollinger band, and later to the lower end of the Bollinger channel.
- The clearly defined targets for each movement provide you with indications for short-term binary options. Whether you trade high/low options or one touch options, you can use the day’s opening price to predict what will happen next.
- Once the market has reached the lower end of the Bollinger bands, you can invest in rising prices. Depending on your preference, you might use high/low options, ladder options, or one touch options. You have enough information for all of these investments.
Of course, these recommendations are only our best guess for what will happen. Keep monitoring what happens in the market, and limit your investment
If you still need a binary options broker, take a look at our broker list, and you will quickly find the right broker for you.