Most binary options traders will benefit from adding the On Balance Volume (OBV) to their strategy. It can help you find profitable trading opportunities and avoid bad ones, thereby significantly increasing the profitability of your strategy.
In this article, you will learn:
- What Is The On Balance Volume (OBV)?
- What Can The OBV Tell Me About The Market
- Why To Use On Balance Volume
- The OBV And The Money Flow Index (MFI)
With this information, you will be able to understand the OBV and use it to improve your binary options trading.
What Is The On Balance Volume (OBV)?
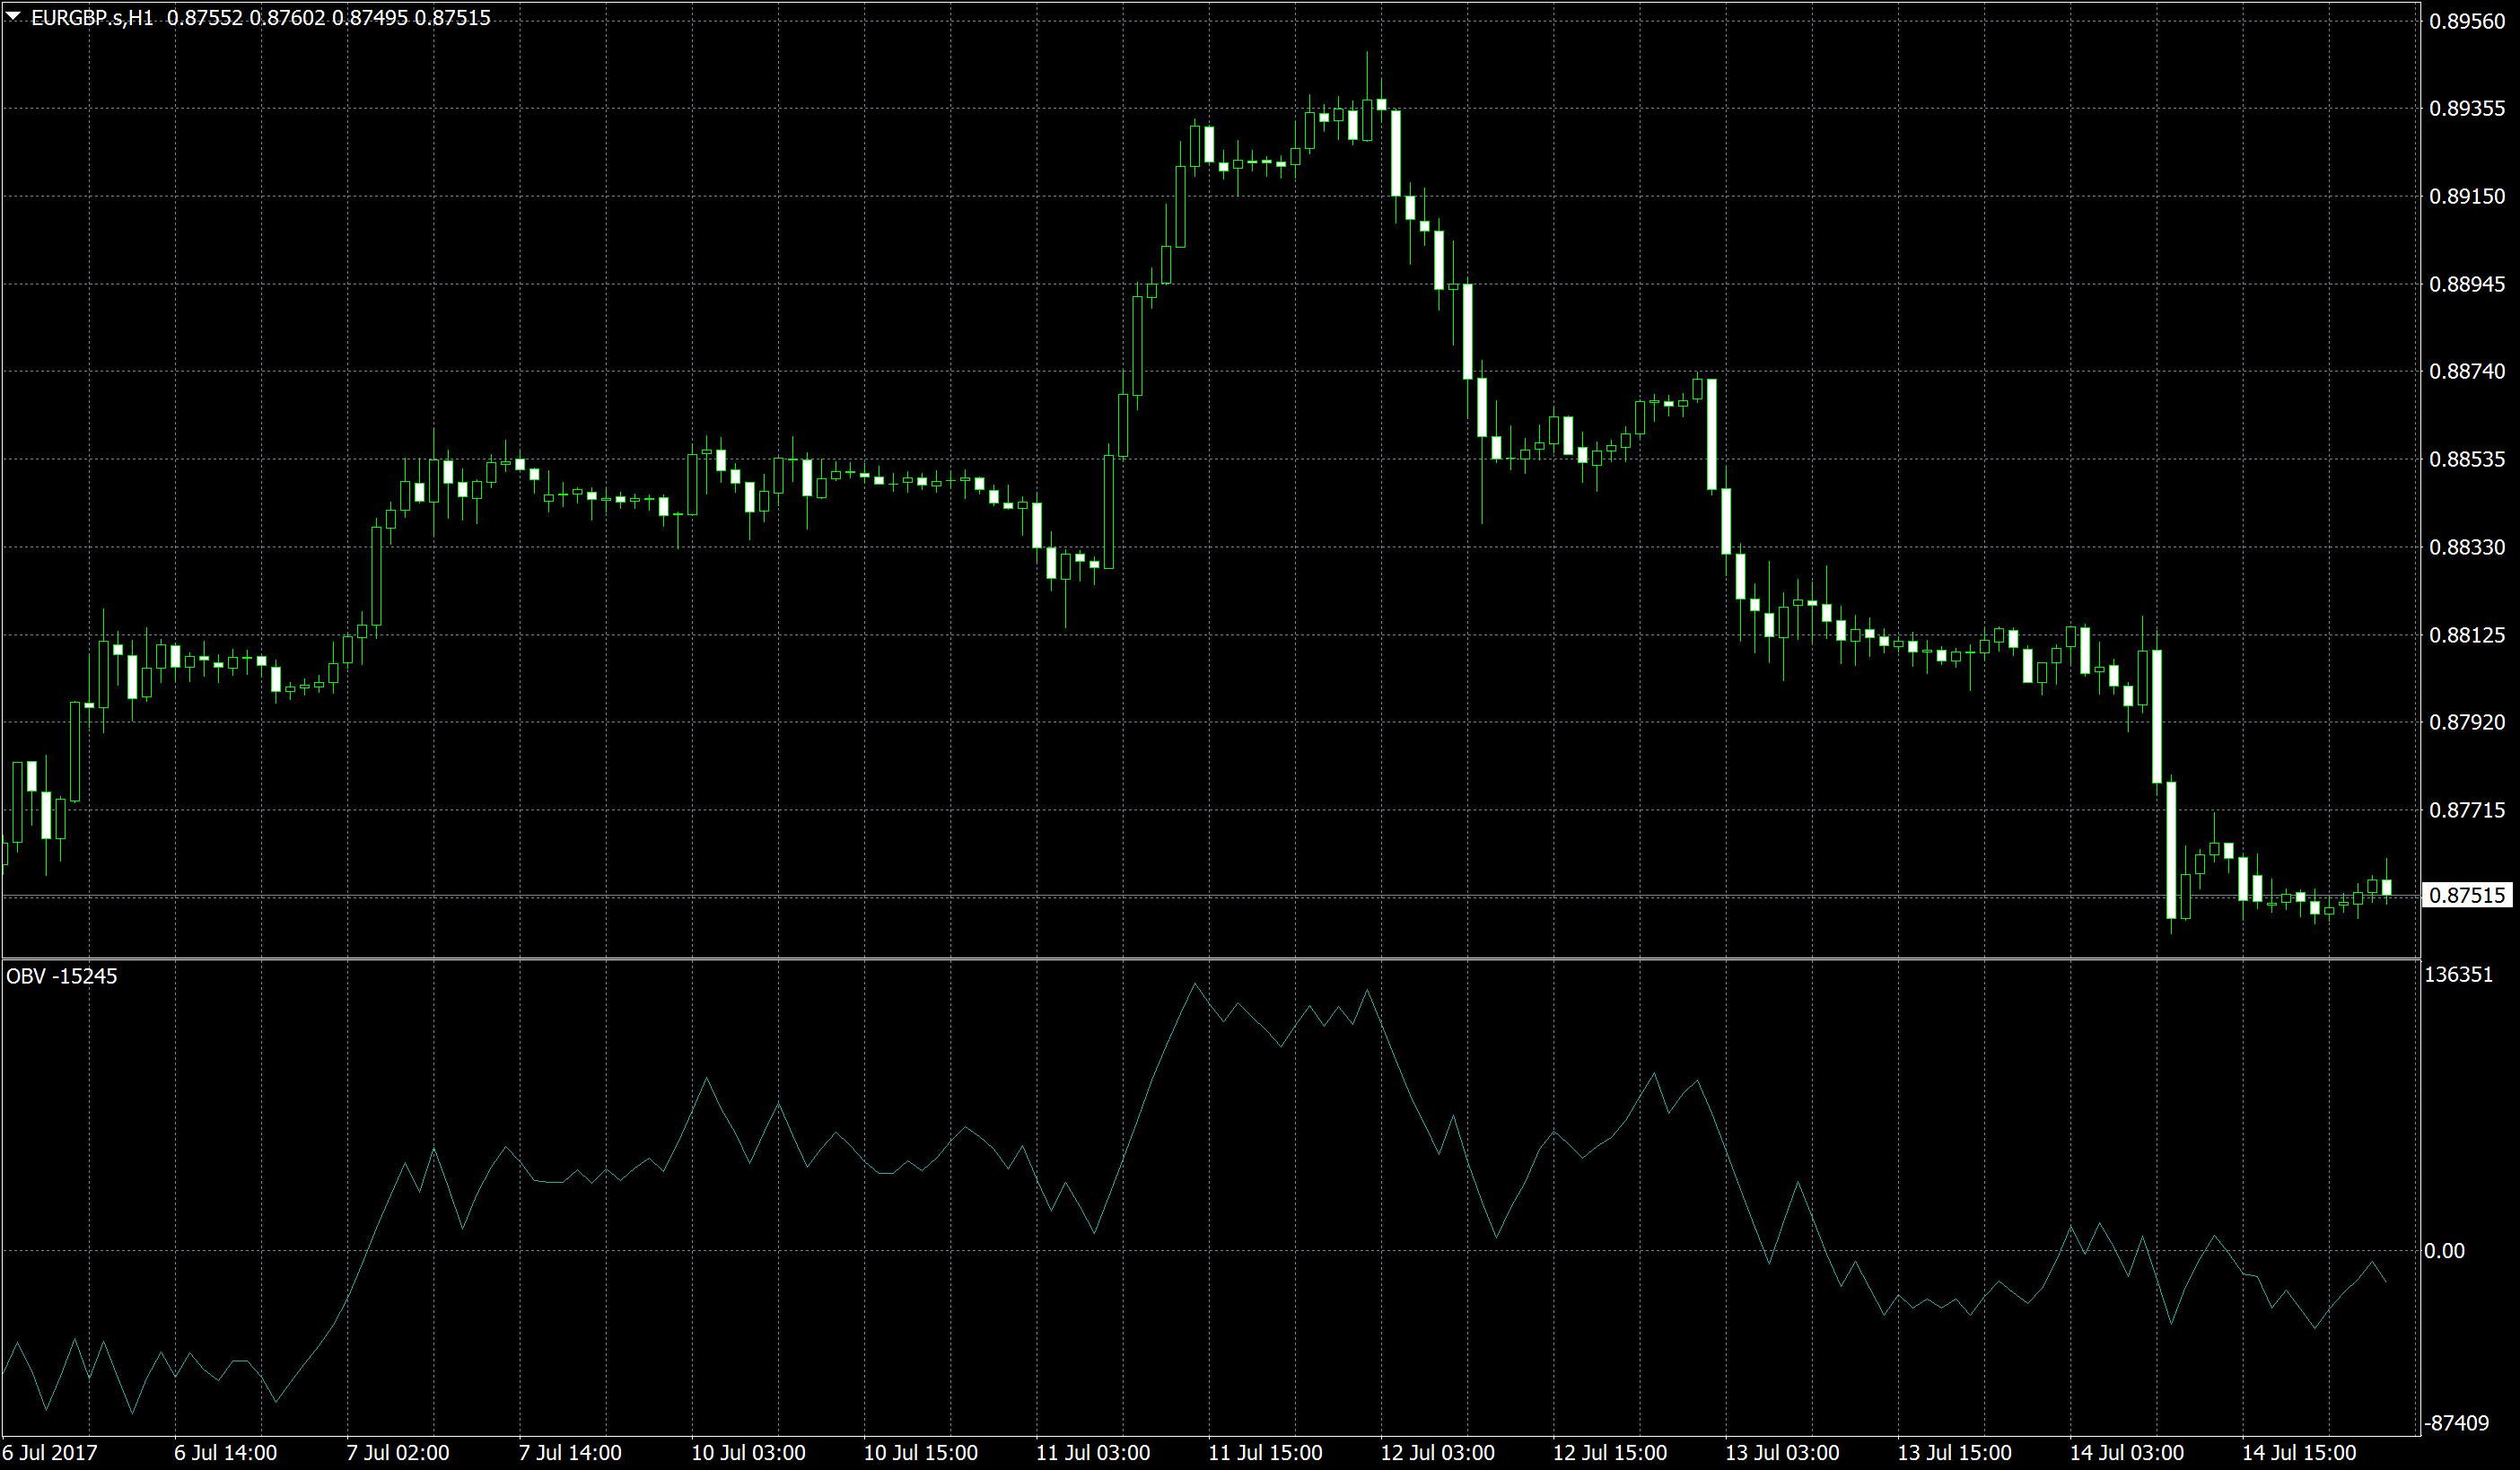
The OBV is one of the most simple-to-understand technical indicators. Its calculation happens in three steps:
- The OBV analyzes the volume of a period.
- If prices rose during the period, the OBV adds its volume to the calculation. If prices fell during the period, the OBV subtracts its volume from the calculation.
- The OBV repeats the process for as many periods as you tell it to.
Mathematically, the OBV’s formula looks like this:
Sum of all volumes of periods with rising prices – sum of all volumes of periods with falling prices
The OBV has the great advantage of being based on a simple calculation. Some technical indicators are so complicated that many traders lose sight of what the indicator does and how they should interpret its results. The OBV keeps things simple, which minimizes the risk of failure and maximizes usability.
The result of the OBV’s calculation tells you whether you should currently place more emphasis on rising or falling periods, which can greatly benefit your trading.
Let’s take a closer look at what the OBV can tell you about the market.
What Can The OBV Tell Me About The Market
The OBV can help you understand whether more traders are currently buying or selling an asset. This indication is important because the volume of a period can tell you a lot about where the market will go.
Every period creates a prediction. For example, candlestick analysis defines hundreds of unique periods and their implications for future market movements.
Even without knowledge of candlestick analysis, you can draw predictions from candlesticks. Candlesticks always predict that the movement could carry over into the next period, too.
- Rising candlesticks always predict that the next candlestick is likely to feature rising prices, too.
- Falling candlesticks always predict that the next candlestick is likely to feature falling prices, too.
Of course, these predictions are highly unreliable. The market often changes direction after a candlestick, and simply predicting that the next period will look like the previous one is an inefficient strategy.
The volume can help you understand whether a period is important or unimportant. Periods with a high volume are more important for predicting future market movements than periods with a low volume.
The OBV takes this assumption, analyzes a number of periods with it, and creates an aggregated result of whether rising or falling periods have the greater volume. This assumption can tell you a lot of things about whar traders think.
You can interpret the OBV in a number of ways:
Analyzing the zero line
Whether the OBV’s reading is positive or negative can tell you a lot about what is going on in the market:
- If the OBV’s reading is positive, the volume of rising periods exceeds the volume of falling periods. This implies that traders are bullish.
- If the OBV’s reading is negative, the volume of falling periods exceeds the volume of rising periods. This implies that traders are bearish.
Most simply, you can use this indication to filter signals.
- When the OBV’s reading is positive, you only invest in signals that predict rising prices.
- When the OBV’S reading is negative, you only invest in signals that predict falling prices.
With a strategy that trades moving average crossovers, for example, you would only trade upwards crossovers when the OBV is above 0, and only downwards crossovers when the OBV is below 0.
Additionally, you can also the OBV’s crossing of the zero line. When the OBV crosses the zero line, the market must have changed direction. Traders were bullish and now became bearish, or the other way around. Now would be a good time to invest in the new direction.
- When the OBV crosses the zero line upwards, invest in a high option.
- When the OBV crosses the zero line downwards, invest in a low option.
The OBV’s crossing of the zero line indicates a general market direction. The next period does not necessarily have to point in the direction of the indication, which is why you should use a medium expiry of at least five periods. In a 10-minute chart, for example, you should use at least an expiry of 50 minutes, if available, or one hour.
You can also trade this strategy with one touch options. Since this options type requires a strong movement, you should add a momentum indicator to your strategy that helps you predict the range of the movement. Based on the OBV alone, this strategy would be too risky.
Analyzing Spikes And Short-Term Moves
Sometimes, the OBV will show a sudden surge or fall. These quick, strong movements are often the result of fundamental changes in market opinion, which is why they can alert you to great trading opportunities.
For the OBV to significantly accelerate its current movement or change direction, there has to be a sudden surge in volume. When many traders are suddenly entering the market, there must be something going on. The effects of this momentum shift are highly likely to carry over to the next periods.
The sudden movement tells you that something is going on, its direction tells you in which direction to invest.
- When the sudden movement accelerates the OBV’s upwards movement or turns the OBV from a downwards to an upwards direction, invest in a high option.
- When the sudden movement accelerates the OBV’s downwards movement or turns the OBV from an upwards to a downwards direction, invest in a low option.
Keep your expiry short, ideally between one and five periods, depending on the signal.
Analyzing Failure Swings
In an intact movement or trend, the OBV should confirm the market’s movements. When the trend or movement reaches moves further, the OBV should mirror the trend. As soon as the trend creates a new extreme without the OBV creating a new extreme, too, the trend is in trouble – this is considered a failure swing.
- When an uptrend creates a new high without the OBV reaching a new high, too, it creates a failure swing.
- When a downtrend creates a new low without the OBV reaching a new low, too, it creates a failure swing.
Failure swings imply that traders have lost faith in the current trade. While there are still enough traders around who invest in the trade to push the market to new extremes, more and more traders distance themselves from the trade. Soon, this changing market sentiment is likely to force the trend to turn around.
This prediction makes sense when you consider that price action is exclusively determined by supply and demand. After periods of high demand or supply, the market eventually reaches a point where everyone who wants to sell has sold, or everyone who wants to buy has bought. Before the trend can continue in its main direction, it has to go through a consolidation that helps it create new momentum. The OBV can help you anticipate these consolidations and adjust your trading accordingly.
Failure swings indicate long-term changes in market direction. These changes take time to develop, which is you should choose a long expiry of at least seven to ten periods. You can use additional indicators such as trend analysis or the Relative Strength Index (RSI) to find the right timing for this type of strategy.
Why To Use The On Balance Volume
There are three good reasons why binary options traders should use the OBV. Those reasons are:
- On the short time frames of binary options, the volume is especially important. They OBV’s usefulness increases on short time periods. When you trade a daily chart, the OBV often shows only small divergences from market movements that are difficult to interpret. Often, you are better off analyzing the volume directly. On short time frames, however, the OBV can more effectively identify changes in market sentiment because the difference between slow and active trading periods is larger. The results are quality predictions that can aid your trading.
- The OBV can make sense of sideways movements before price action can. When the market is moving sideways in seemingly random ways, price action often provides little information about the direction in which the market will break out of the pattern. The volume can do a better job, especially when aggregated in such a clear way as with the OBV. When the OBV is on the rise, you know that the market is likely to break out in an upwards direction; when the OBV is on the decline, you know that the market is likely to break out in a downwards direction. Often, the OBV is the only way of understanding this relationship.
- The OBV volume can help you avoid bad trades. Often, price action can be a little deceiving. The market seemingly moves in one direction, but just when you invest, it turns around. The OBV can help you avoid such bad surprises. By adding the OBV as a filter to your current trading strategy, you can increase your winning percentage and your overall profit. It will help you to understand the weight of the many different indications that the market provides at any time and make the best decision possible.
Simply put, the OBV can help you find profitable trading opportunities and avoid bad ones. Both effects alone would be more than enough reason to add the OBV to your strategy. Combined, they can significantly increase your profits.
Generally, every trader should at least have an eye on the volume. You can use the OBV, another technical indicator, or monitor the volume directly, but you should definitely choose one of these options.
The OBV And The Money Flow Index (MFI)
You might have noticed that the OBV shares a lot of similarities with the Money Flow Index (MFI). Both indicators compare the volume of rising and falling periods. The difference between both indicators is that the MFI pays more attention to price action.
- The OBV uses price action as absolute criteria. The volume of periods with rising prices is added to the calculation, the volume of periods with falling prices is subtracted. The length of a period is unimportant. A period that moved prices by 5 percent is just as important to the MFI as a period that moved prices by 0.1 percent.
- The RSI uses price action as relative criteria. It multiplies the volume of periods with their range, which is why a period that moved prices by 5 percent will be 50 times as important as a period that moved prices by 0.1 percent.
This difference determines whether you should use the MFI or the OBV for your analysis.
- If you want a purely volume-based indication with as little influence of price action as possible, the OBV is the ideal indicator for you.
- If you want a larger influence of price action in your analysis, go with the MFI.
The other important difference between the MFI and the OBV is the way in which they display their results:
- Because the OBV adds up the results of its calculations, it creates an absolute value. Depending on the asset and trader activity, the MFI might read 5,224,946 or 196. The absolute value of these numbers is of less importance than their change over time.
- Because the MFI relates the value of rising periods to those of falling periods, it always creates a result between 0 and 100. The result itself can tell you something about what is going on in the market and what you should do.
Conclusion
The On Balance Volume is a helpful technical indicator that combines volume and market movements in one of the most direct ways possible. The result is a simple to interpret indicator that can help you find good trading opportunities and avoid bad ones, thereby significantly improving your results. Most traders will benefit from adding the OBV to their strategy.
To trade the OBV, you can focus on the zero line, sudden movements, or failure swings. Each trading style can be the basis of a money-making strategy, and you should pick the style that best suits your character.
If you still need a good broker with which to trade the OBV, take a look at our top list of available brokers.