In June 2017, the EURUSD currency pair offers unique opportunities. Binary options are the ideal tool to take advantage of them. This article explains how.
What will happen to the EURUSD in June 2017?
To understand what will happen to the EURUSD in June 2017, consider this daily price chart.
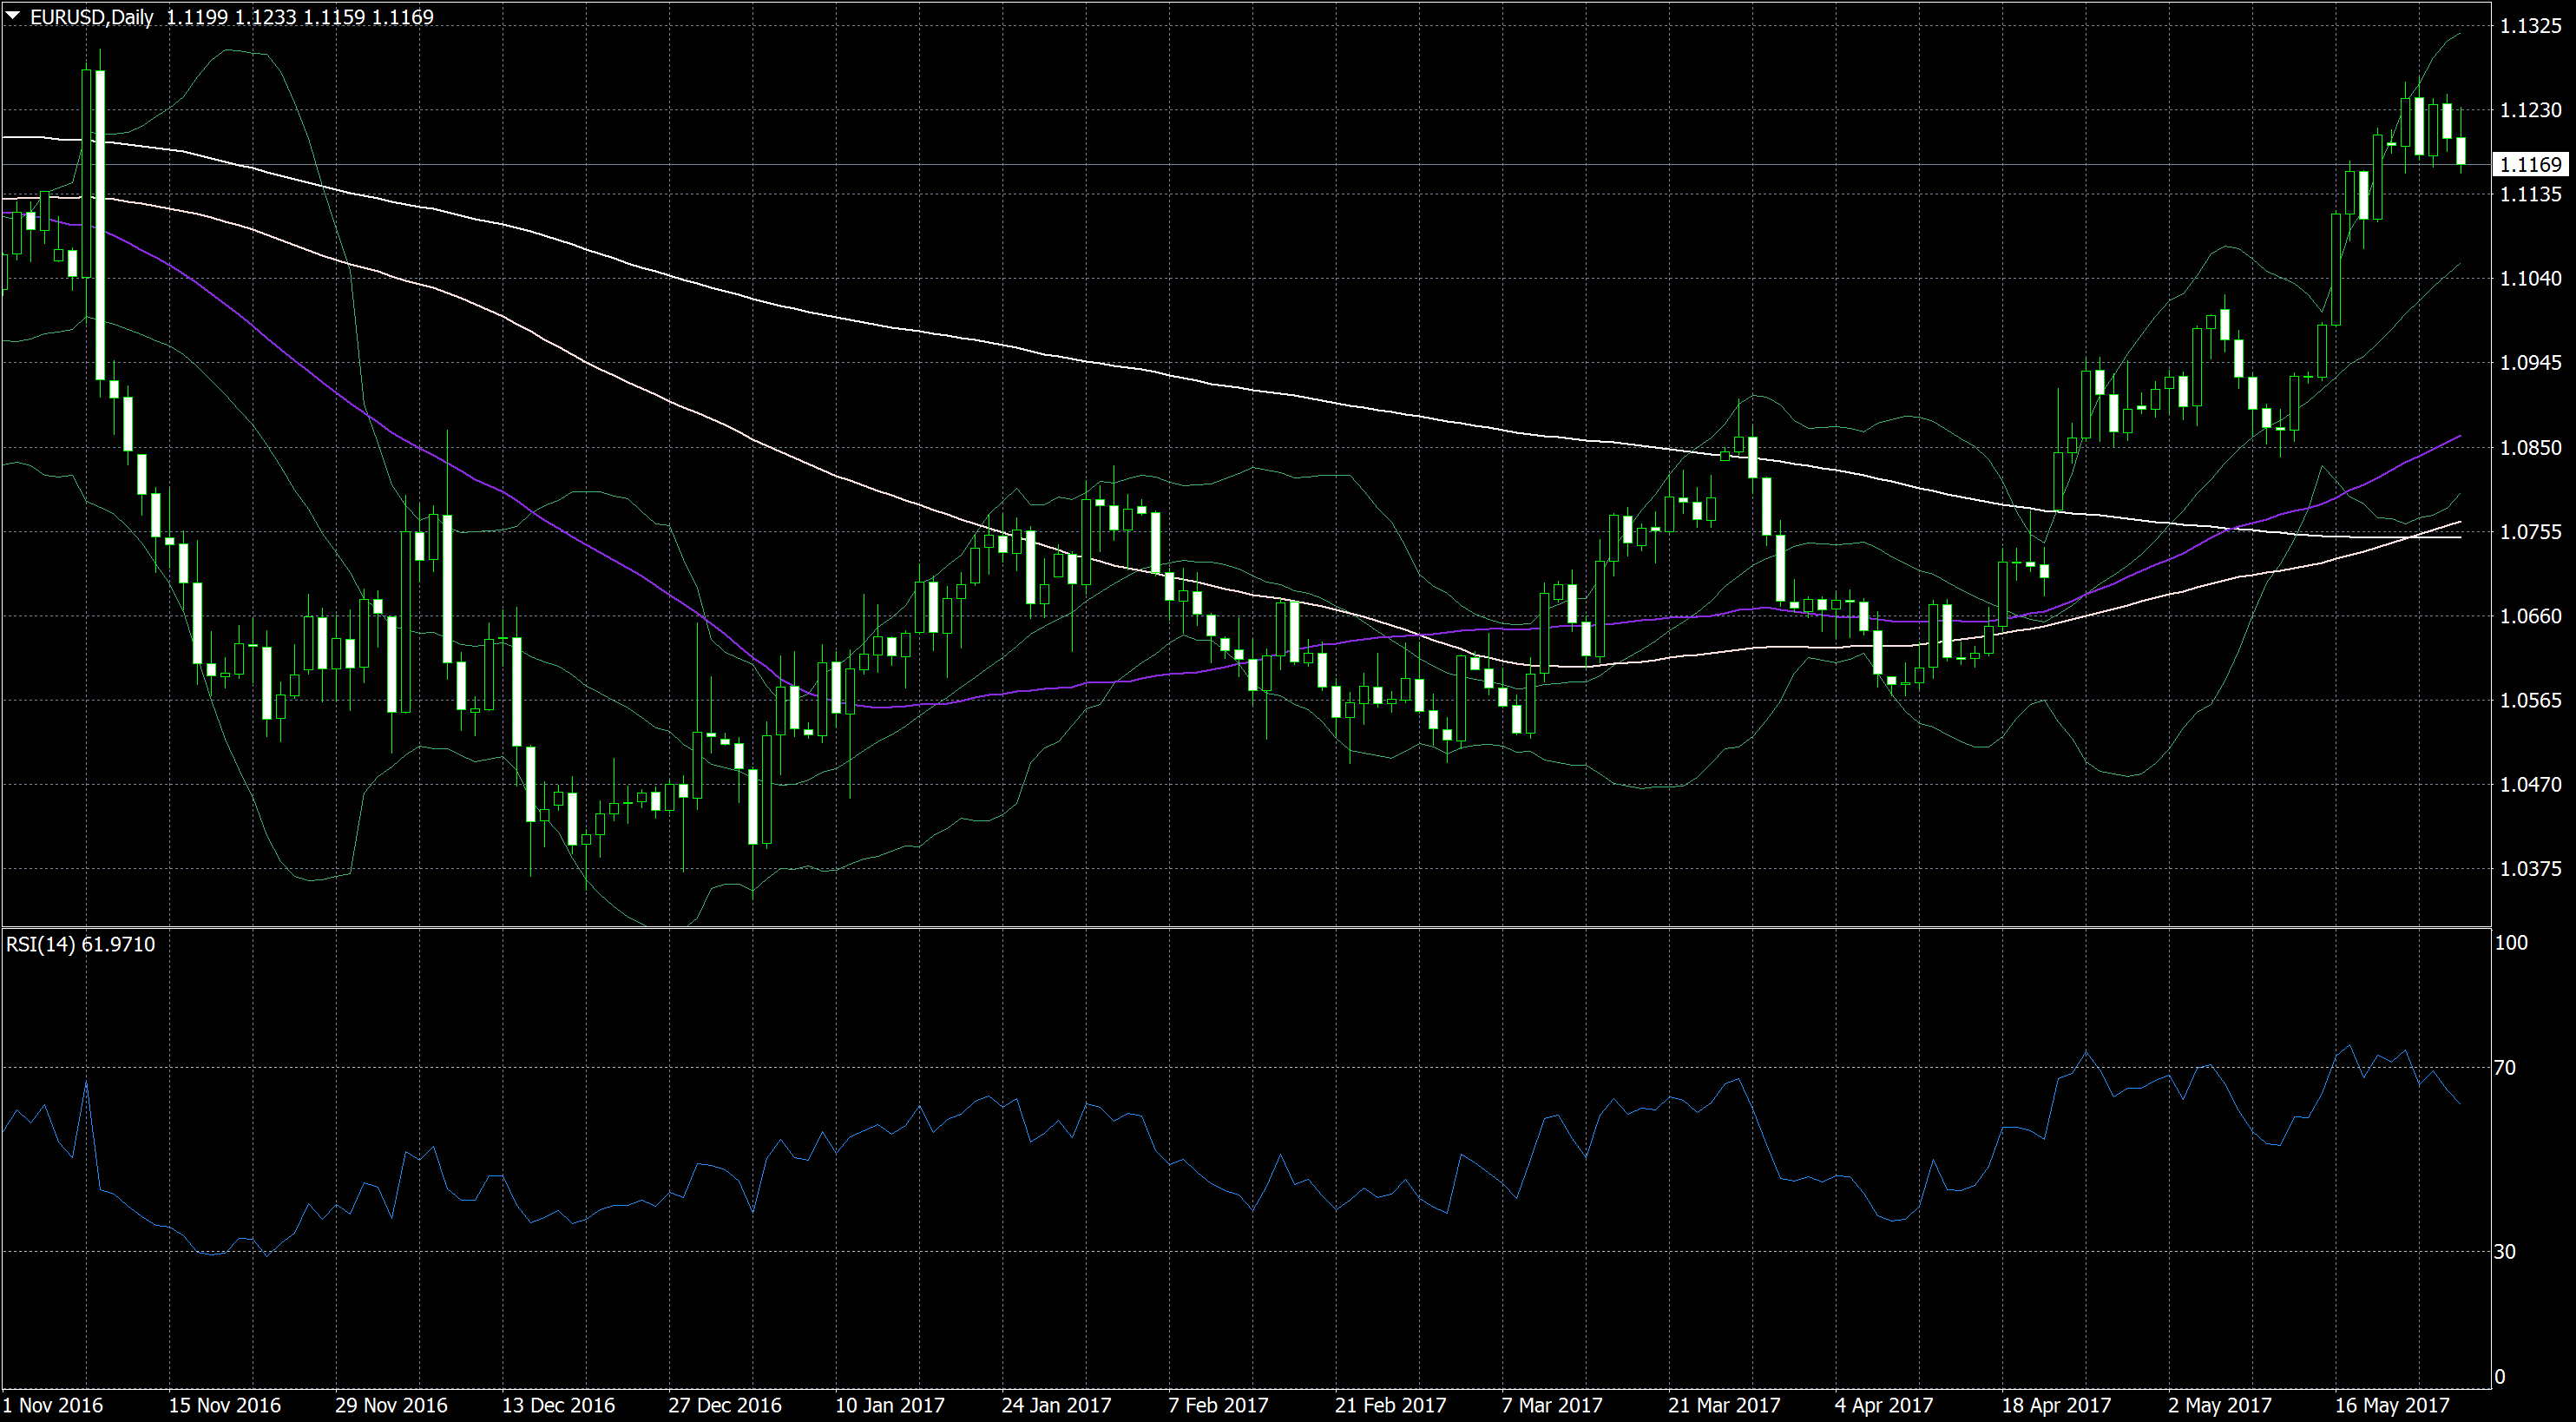
This chart uses a period of one day and displays five indicators – Bollinger bands, a 50-day moving average, a 100-day moving average, and a 200-day moving average, and the Relative Strength Index (RSI). These indicators are great to understand the big picture and predict what will happen during the entire month.
The chart helps us to immediately understand a few things about the market:
- The price is in an uptrend. Since April 2017, the market has started trending upwards. It has gone through a brief consolidation around May 2, and it seems to enter a new consolidation period now.
- The moving averages indicate rising prices. The shortest moving average is closer to the current market price than the medium moving average, which is closer than the longest moving average. This stacking indicates a strong sense of direction and supports the market’s upwards tendency. Additionally, the market is trading significantly above all three moving averages, which means that its upwards momentum will continue.
- The market is trading at the upper range of the Bollinger bands. The market has reached the upper range of the Bollinger bands, which seems to have slowed down his momentum. In combination with the fact that the trend seems to be entering a consolidation period, the Bollinger bands strongly indicate that the market will have to go through a reversal or a sideways movement before it can continue to rise.
- The MFI has just left the overbought area. The MFI had entered the overbought area, which is a strong sign of an impending consolidation. Since then, the MFI has left the overbought area, which indicates that the reversal is underway.
Final prediction: The market is in an uptrend but currently going through a consolidation. Until this consolidation ends, expect a sideways movement with a slight downwards tendency. The consolidation should last at least until the middle line of the Bollinger bands catches up with the market, which should take around ten trading days.
How to trade this prediction with binary options
To trade this prediction with binary options, there are some ways:
- Expect volatility, invest accordingly. The first conclusion is of a general nature. The market is in a consolidation, which means that it lacks direction. Upwards and downwards periods will alternate often. During these periods, it is better to keep your expiries short and avoid binary options types that require a strong sense of direction such as ladder options. Prefer high/low options or boundary options.
- If you invest long-term, invest for at least five days. It seems highly likely that the market will fall back to the middle Bollinger band over then next 8 to 12 trading days. A long-term low option with an expiry of at least five days can take advantage of this prediction. Shorter expiries, however, are too risky in the volatile market environments.
- Short-term traders should monitor the trend’s previous high. The market is unlikely to rise above the trend’s previous high before it has not touched the middle Bollinger line. This prediction provides you with a good prediction for trading ladder options or high/low options based on the current market’s price distance to the previous high.
Of course, these recommendations are only our best guess. Monitor the market and adjust your predictions, if necessary.
If you still need a broker with which to trade the EURUSD, take a look at our broker list. It will help you find a great broker with only two clicks.