The Commodity Channel Index (CCI) is a great indicator for binary options traders. It creates clear, unambiguous predictions that help you succeed in a fast-paced environment. This article will explain how the CCI works and how you can use it to improve your binary options trading.
In detail, this article will answer these questions:
- What Is The Commodity Channel Index Formula?
- How Does The CCI Work?
- Why Use The Commodity Channel Index?
- Trading Using CCI
With this information, you will be able to use the CCI to more profitably trade binary options.
What Is The Commodity Channel Index Formula?
The Commodity Channel Index (CCI) wants to identify market environments in which the price has moved too far from its statistical mean and has to come back.
The idea behind the CCI can be best explained with a real-life example. Think of the price of an apple over the last hundred years. At some point, the price of an apple was half of what it is today. And at some point earlier, it was a quarter of what it is today, and at some point one-eighth.
The point is, the price of an apple rose significantly and gradually. It would have been impossible for the price to quadruple overnight. If all shops had agreed at some point to raise the price of an apple from £0.1 to £1, people would have stopped buying apples and bought another fruit instead. Those shops would have had to admit their mistake and bring the price back to £0.11 – a more gradual price change.
Once customers feel more comfortable with the new price, the shops might be able to raise the price again, for example to £0.12. But for the price change to work, it has to be gradual. Otherwise, customer psychology would bring the price closer to where it was before.
The CCI adapts this idea to a market analysis formula.
- When the price of an asset rises too far, fewer traders will be willing to buy the asset for what they consider a too high price. Demand will be low, and the market has to fall back closer to its statistical mean.
- When the price of an asset falls too far, fewer traders will be willing to sell their asset for what they consider a too low price. Supply will be low, and the market has to rise back closer to its statistical mean.
Simply put, when the market is close to its statistical mean, a lot of things can happen. But when it has moved too far from it in one direction, you know that market psychology will bring it back closer to its statistical mean. The formula offers a quick reflection of this.
How Does The CCI Work?
To identify markets in which the price has moved too far from its statistical mean, the CCI focuses on three factors:
- The current typical price. The typical price is the average of the last period’s high, low, and closing prices. Essentially, this is the current price level of the asset.
- A simple moving average. The simple moving average provides the statistical mean price.
- The mean absolute deviation. The mean absolute deviation measures how far the price of this asset, on average, strays from its mean price.
With these three components, the CCI formula relates the distance between the current typical price and the simple moving average to the mean absolute deviation. The final result is then multiplied by 0.015 to create a more readable result.
Mathematically, the formula looks like this:
(Current typical price – simple moving average) / mean absolute deviation./ 0.015
Around 70 to 80 percent of the CCI’s readings are somewhere between -100 and +100. The other 20 to 30 percent are outside these boundaries and indicate overbought and oversold markets.
- Values over 100 indicate overbought markets. The market has risen too far and is likely to fall soon.
- Values under 100 indicate oversold markets. The market has fallen too far and is likely to rise soon.
The CCI draws the result of this calculation into a price chart. The resulting line, its current value, and its change over time can tell you a lot about what is going on in the market and what will likely happen next.
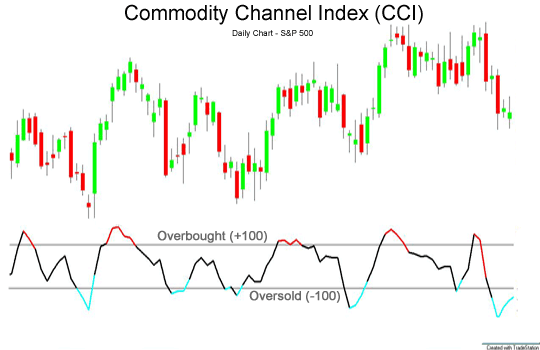
In addition to its overbought and oversold areas, the CCI also creates a signal when it diverges from the market.
In an intact trend, the CCI mirrors the trend’s movements. When an uptrend creates a new high, the CCI should create a new high, too; and when a downtrend creates a new low, the CCI should create a new low, too.
When the CCI fails to create a new high/low as the trend creates a new high/low, it diverges from the market. This divergence is a strong indication that the trend has lost momentum. It is likely to end soon, and the market is likely to turn around.
Some traders also trade breaking trend lines in the CCI. These traders try to find the type of trends that you would normally trade in price action in the CCI’s movements. They establish trend lines and predict that trends will continue. When the CCI breaks a trend line, they predict that the market will turn around.
Personally, we do not recommend using this technique. As you can see in the picture above, it is difficult to identify trends in the CCI. It mostly moves in straight lines and trying to find non-existent patterns can only lead to mistakes.
Why Use The Commodity Channel Index?
The CCI offers a number of advantages that make it a great fit for binary options traders. Those advantages are:
- The CCI work especially well for short time periods. Long-term trends are often driven by fundamental factors that can, at least partially, outweigh the psychological effects that the CCI tries to measure. Binary options are short-term investments, and on these short time periods, there are almost no fundamental influences. Therefore, the psychological influences are stronger, and when the CCI turns around in an extreme area, the market will almost always follow the movement with a few candlesticks in the direction that the CCI predicts. This is the perfect environment for winning trades based on the CCI.
- The CCI is straightforward, quick-to-analyse, and creates clear predictions. Binary options traders have to operate in a fast-paced environment. They need tools that help them make clear, quick decisions without hesitation or confusion. The CCI is such a tool. It provides a clear reading, and if this reading is larger than +100 or smaller than -100, you know that this is a trading opportunity. If it is not, you can continue with the next asset or the next period. This is exactly the trading style you need.
- The CCI allows for short-term predictions. Depending on how you use the CCI, it creates predictions on different time scales. This is a great characteristic, because it means that you can create short-term prediction that only apply to the next few candlestick. With a strategy based on these predictions, you can make many trades per day; and with a good strategy, many trades equal big profits. Therefore, the CCI is ideal for traders who want to maximize the profitability of their trading.
These three characteristics are a good reason why binary options traders should get to know the CCI.
Trading The Commodity Channel Index
To understand how you can trade the CCI, take another look at the picture that we used earlier. As you can see there, the CCI creates very different predictions based on whether you trade its extreme areas or its failure swings.
Divergences do indeed indicate environments in which the market is likely to move closer to its statistical mean – but that is all they do.
- A divergence does not indicate that the market will reach its mean or cross it to the other side. It only indicates that the market will move temporarily closer to its means.
- A divergence does not indicate a trend will end or that another trend in the opposite direction will start. It only indicates that the current trend has to take a break.
Despite a divergence not indicating these events, they are possible. They might or might not happen – a CCI divergence simply does not allow for long-term predictions. It focuses on the short term.
Failure swings, on the other, only allow for longer predictions. They offer no short-term indication. Once you understand this essential characteristic, you can correctly trade the CCI.
Here are three strategies that do that.
Strategy 1: Trading The CCI’s Extreme Areas With High/Low Options
The easiest way of trading the CCI is with high/low options. This strategy can be explained in two steps:
- Wait for the CCI to enter an extreme area.
- Invest in a high/low option that predicts that the market will move back closer to its statistical mean.
The crucial aspect of this strategy is finding the right timing to invest. You have three options:
- You can invest right when the CCI enters the extreme area.
- You can invest when the CCI is in the extreme area and begins to turn around.
- You can invest when the CCI leaves the extreme area.
All three options can work equally well, and you should choose the one with which you feel the most comfortable.
The important thing is to adjust your expiry to your investment time.
- When you invest as soon as the CCI enters an extreme area, you invest early. Consequently, you have to use a longer expiry. We recommend somewhere around two to four periods. If you are trading a chart with a period of 10 minutes, we recommend using an expiry between 20 and 40 minutes.
- When you invest when the CCI leaves an extreme area, you invest in an already developing movement. Consequently, you have to use a shorter expiry. Win the trade and get out. We recommend an expiry equal to the length of one chart period.
- When you invest when the CCI turns around, you are somewhere between the first two options, and your expiry should reflect that.
Try to find the perfect timing and the right expiry for you. This might require a little testing and trial and error. Use our recommendations as guidelines, but find your strategy, even if it conflicts with what we write.
Strategy 2: Combining The CCI With Candlestick Formations And Multiple Option Types
As we pointed out, the CCI creates only short term predictions about the market’s direction. By adding Candlestick formations to your strategy, you can make more detailed predictions that allow you to trade binary options types with a higher payout and make more profit.
Candlestick formations are significant patterns of candlesticks that allow you to predict what will happen next. There are simple candlestick formations that consist of only one or two candlesticks and more complex formations that consist of more candlesticks, sometimes up to ten. To keep things simple, this article focuses on simple candlestick formations. You can adapt the strategy to more complex formations if you like.


One simple candlestick formation is the big candle. The big candle consists of a single candlestick that is significantly larger than the preceding candlesticks. Its body makes up almost the entire candlestick, and there are no wicks or only small wicks.
The big candle indicates a strong movement. Apparently, the market strongly moved in one direction for the entire period, which is why it is likely for this momentum to carry over to the next period.
Now let’s combine the big candle with the CCI. Assume that the CCI enters the overbought area and, a little later, the market creates a bearish big candle. Now you know two things:
- The market is likely to fall for more than one candlestick.
- The market seems to fall strongly and quickly.
Combined, both predictions create the ideal environment for trading a one touch option. These options define a target price, and as soon as the market touches this price, you win your option. One touch options require a stronger movement than high/low options but they allow you to win your option with a single touch of the target price and usually generate higher payouts.
In such a situation, it makes great sense to trade a one touch option and maximize your potential profit.
Now let’s assume that the market does not form a big candle once the CCI reaches the overbought area. It forms a smaller candlestick with a wick to both sides. While the CCI begins to fall, this candlestick does not indicate the strong momentum that the big candle predicts. Consequently, you know that you have to be careful.
In this situation, it would be better to trade a low option. You might get a lower payout, but you can win the option with the smallest possible movement in the right direction – as long as the market trades lower when your option expires, you win.
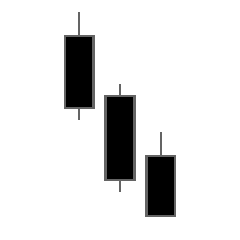
And finally, let’s assume that the market does create the bearish big candles in a row after it entered the overbought area. This formation is known as three black crows and indicates a bearish reversal.
At this point, you would have already won the trade from the first big candle. You would be able to win a second trade by predicting that the market will continue to fall. Most traders would use a low option for this prediction, but if the market environment seems right to you, you might also be able to trade a one touch option.
The point of this strategy is to show you how candlesticks and the CCI can reinforce or weaken each other’s prediction. The result is a clearer picture of the market, which allows you to trade better and more accurately.
There are many, many simple candlestick formations. The big candle is just one of them. Pick those that you like best; there is no need to rely on the big candle if you do not like it.
Strategy 3: Trading CCI Divergences With High/Low Options
This strategy utilizes the CCI’s second prediction that divergences indicate the end of the existing trade. It is simple, too, but it creates predictions for the long-term.
Here’s what you do:
- Find a trend. To trade divergences, you need a trend first. Survey the market and find a trend.
- Monitor the CCI. Once you have found a trend, start monitoring the CCI. As long as the CCI mirrors the trend, you can predict that the trend will continue. Use high/low options, and match your expiry to the average time between two swings.
- Trade the divergence. Once the CCI creates a divergence, predict that the market will turn around. Use an expiry longer than the average length of a swing.
This is it. This strategy is simple, but it requires a little more time to execute. You have to search for trends and monitor the CCI closely. On the other hand, you get much more signals once you have found a trend.
This is an example of a strategy that utilizes the CCI’s long-term predictions. Of course, long-term predictions in the sense of binary options are relatively short compared to other assets. When you trade this strategy on a 5-minute chart, you will probably use expiries between 30 minutes and two hours. With a strategy that trades the CCI’s short-term predictions, however, you would use expiries of 5 to 15 minutes, so there is a significant difference.
Conclusion
The CCI indicator is a great indicator for binary options traders. It creates clear, unambiguous predictions that help you succeed in a fast-paced environment. It measures how far the market has moved away from its statistical mean and predicts that when the market moves too far, it has to move back.
You can trade the CCI’s extreme areas or failure swings. The extreme areas create short-term predictions; divergences create long-term predictions. Use one of the three strategies that we presented or adapt them to your preference.
If you still need a good broker with which to trade the CCi, take a look at our broker list.