Trading simple candlestick formations with binary options is a simple yet effective trading strategy everyone can execute. We explain the strategy and how you can use it to make money with binary options.
In this article, you will learn:
- What Are Candlesticks?
- What Are Simple Candlestick Formations?
- Candlestick Strategy
With this information, you will immediately be able to start trading simple candlestick formations with binary options.
What Are Candlesticks?
Candlesticks are a way of displaying market movements. They are an improvement over the line charts that you see on TV and in the newspaper. To understand the purpose of candlesticks, let’s look at why they were developed.
Line charts display and asset’s price movement in a simple line, which has significant downsides. When you look at a chart that displays the price movements of an entire year, for example, a line chart is unable to include a dot for every single price during that year.
Price Charts
When you look at a price chart that is half the size of your hand, you are not seeing the millions of prices for which this asset traded during the year, you see 50 prices, if you are lucky. Maybe the chart selects one price for each week and connects them, or maybe it uses two prices for each week or only one for each month. In any case, you only see a fraction of what was going on.
Even on shorter time frames, you only see part of the picture. The price of most assets changes every second, and no line chart can display this information. Even in a chart that displays the price movements of the last hour, you only see a fraction of what was going on.
Missing Data
When you miss out on a lot of information, you can make bad decisions. To understand why, assume that an asset was in an upwards movement. Now the movement has stalled. During the last period, the price still began to rise, but eventually turned around and entered a fast decline. Now, at the end of the period, it has fallen to roughly the same level as in the beginning.
In a line chart, this period would be displayed as a simple sideways line. It would be indistinguishable from a period during which nothing happened, and the market has moved sideways. Similarly, a period that started with falling prices and ended with a strong upwards movement that took it back to its opening price would look the same, too. This is problematic because the implications of both periods are fundamentally different.
Hidden Indicators
- In a period where the market moved upwards and then turned around, the market is now strongly moving downwards. It is likely that this movement will continue and that the next period will feature falling prices, too.
- In a period where nothing has happened, the market could have gathered new momentum. Such a period provides little reason to discard your previous predictions.
- In a period where the market started to fall but then turned around, the market is now strongly moving upwards. It is likely that this movement will continue and that the next period will feature rising prices, too.
The bottom line is: in a line chart, very different periods can look the same. This vagueness can lead to bad trading decisions, lost trades, and lost money.
Candlestick Patterns Show Extra Data
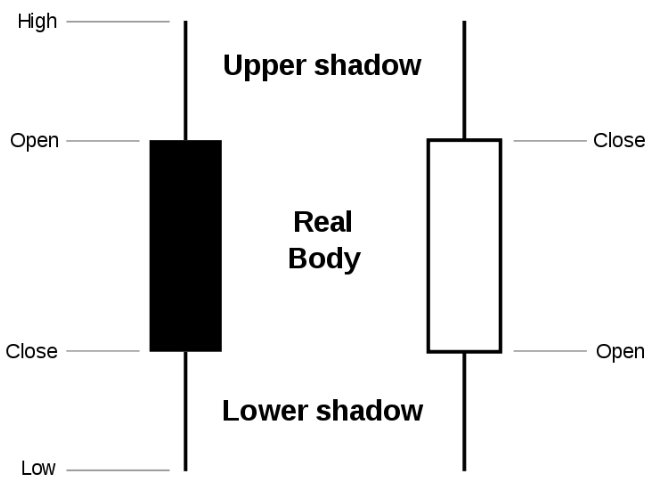
Candlesticks solve the vagueness problem by displaying every price of a period in a simple way. A candlestick consists of a thick body and two thin wicks to the top and the bottom.
- The body represents the price range from opening to closing price.
- The wicks represent the high and the low of each period.
- Candlesticks with rising prices are coloured differently than candlesticks with falling prices.
This simple system tells you everything you need to know about a period. The wicks represent the extremes that the market was unable to hold; the body represents the effective movement of each period.
Candlestick charts consist of hundreds of candlesticks, each of which aggregating the market movements of a specific period.
Typical periods range from 30 seconds (each candlestick aggregates the market movements of 30 seconds) to 1 day (each candlestick aggregates the market movements of an entire day). By changing the period, you can zoom in and out and discover the layers of the market.
What Are Simple Candlestick Formations?
Simple candlestick formations are special candlesticks that allow you to predict future market movements.
Think of our earlier example: where a line chart would have shown you the same sideways for all three movements, candlesticks paint a clearer picture:
- When a candlestick has almost no body but a long wick to the top, you know that the market has moved upwards but then turned around. Currently, prices must be on the decline.
- When a candlestick has almost no body but a long wick to the bottom, you know that the market has moved downwards but then turned around. Currently, prices must be on the rise.
Simple Indicators
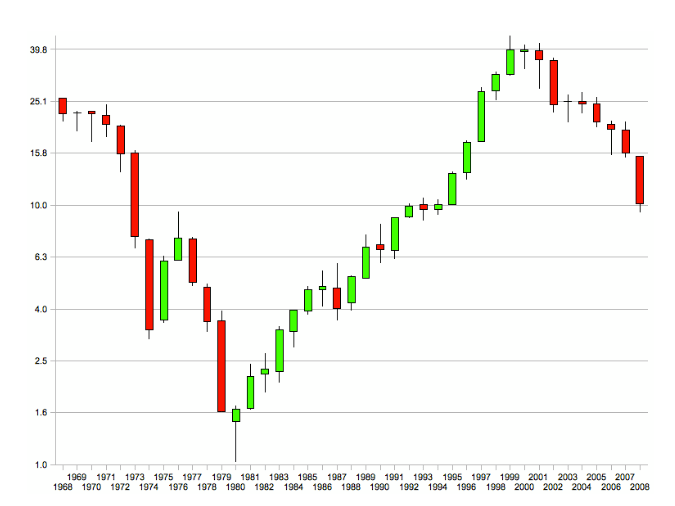
With these simple conclusions, you know what is happening and what will happen next. Take a look at the picture above, for example. At first, the market was falling. In 1980, we had a candlestick with a long wick to the bottom but an upwards body. Even if you look for nothing else, you can immediately conclude that the market fell significantly but turned around and rose again.
This momentum is likely to carry over to the next candlesticks. This is exactly what happened. Whenever you see a similar candlestick after a strong movement, you can conclude that the market will turn around with the next candlestick.
The candlestick in this example is called the hammer. There is also the inverted hammer, which is a sign of downwards momentum.
Here are more simple candlesticks you can use for your trading:
The big candle

The big candle has a large body than its surrounding candlesticks and a small or non-existent wick. It indicates that the market has strongly moved in one direction with little hesitation or doubt. This strong momentum is likely to carry over to the next candlestick. An upwards big candle is a sign of strong upwards momentum, a downwards big candle is a sign of a strong downwards momentum.
Dragonfly doji & gravestone doji

In a dragonfly doji, the opening and closing prices are at the top of the trading day and there is a long wick to the bottom. The gravestone doji is an inverted dragonfly doji with the opening and closing prices at the bottom and a long wick to the top. This candlestick is similar to the hammer: the market has obviously turned around during the period and is now pushing in the direction of the opening and closing prices, but it failed to push far enough to create a hammer.
Consequently, the dragonfly doji indicates an upwards momentum and the gravestone doji a downwards momentum, but these indications are weaker than a hammer.
Doji & long legged doji

A doji is a candlestick with almost no body but a wick to the top and the bottom. Dojis indicate that the market is currently unsure where it wants to go. Dojis often happen near the end of the trading day, when most traders have stopped trading and volume is low. While a doji is a sign of a slow market, long legged dojis are signs of strong forces in balance. You can expect that one force will soon win over the other, pushing the market strongly in one direction.
Other simple candlestick formations
There are hundreds, if not thousands of simple candlestick formations – even the smallest variations have their own names. Instead of learning them all by heart, we recommend understanding the system behind them:
- Body: A long body indicates a strong momentum in the direction of the candlestick. A short body indicates a market with no clear direction.
- Wick: A long wick to one side indicates that the market has turned around. Long wicks to both sides indicate indecisiveness.
Combine these two indications, and you can interpret every single candlestick you see without having to learn any formation by heart. Try to understand the market’s direction and momentum, and you will immediately know what is going on.
Candlestick Strategy
Binary options traders can trade simple candlesticks in three ways:
- Trade single candlesticks.
- Paint a larger picture.
- Combine candlesticks with other indicators.
Let’s look at these strategies one by one.
How to trade single candlesticks
Single candlesticks allow for short-term predictions. Since they are based on only one candlestick, they only apply for the next one or two candlesticks. A big candle, for example, predicts that the next candlestick will feature rising prices, but after that, it lacks the ability to paint a clear picture.
If you want to trade a single candlestick, you have a few options:
- High/low options, short expiry: When you trade a single candlestick, you can invest in a high/low option in the direction of the candlestick’s momentum. Search for candlesticks with a clear momentum indication, for example a big candle, and keep your expiry short. You expiry should be no longer than the length of one period. In a 30 minute chart, keep your expiry at or under 30 minutes.
- One touch options: After simple candlestick formations that indicate a strong movement, for example a big candle, you can invest in a one touch option, predicting that the strong momentum will push the market far enough to trigger the target price. Ideally, you would use a target price that is less than one-third of the big candle’s size away from the current market price. Use the longest expiry that offers a target price within this distance.
- Boundary options: For binary options traders, dojis and long legged dojis offer the opportunity to win a trade. During these formations, the market was in the balance, unsure about where to go. This insecurity can’t last long. The market will soon break out of the doji. If you can find a boundary option, you can profit from this prediction. Search for a boundary option that offers target prices within the doji’s price range and use the longest expiry that you can get.
You can focus on a single of these strategies or combine them and pick the one that suits your current market environment.
How to trade the big picture with digital options
Instead of trading single candlesticks, you can also trade the sum of all candlesticks that you see. Typical prices charts have dozens of candlesticks, and their combination can tell you a lot about what is going on.
For example, assume that you see these candlesticks in a row: downwards big candle, upwards hammer, upwards big candle.
These three candlesticks create a vivid picture of what is going on: the market fell in the first period, then turned around in the second period, and continued to rise strongly in the third period.
Compare to trading just the big candle alone; this widened scope increases your ability to predict what will happen. You know that there has been a significant shift in market sentiment, making it likely that the new movement will continue for quite some time.
Longer Expiries
With this knowledge, you gain more investment possibilities. Since you can predict a longer movement than with a big candle alone, you can invest in a high/low option with a longer expiry. You can also use a one touch option with a target price up two times as far from the current market price as the size of the big candle. If your broker offers ladder options, you might even find a profitable opportunity to get a very high payout.
Of course, you can also combine this strategy with trading single candlesticks. The key is always to be honest about what you know.
- If you can only interpret the last candlestick, limit yourself to a short time investment.
- If the last three or four candlesticks all tell the same story, you can additionally invest in an option with a longer expiry or a higher payout.
- If you have already invested in a movement, won the option, and the next candlestick confirmed your prediction, you can invest again. In this way, a single movement can easily offer four or five chances to win a binary option.
Combine candlesticks with other indicators
Candlesticks can be a great way of finding the right way for trading other indicators. When you are trading trends, swings, or technical indicators, you often know that the market will change direction soon, but you might be unsure when. Candlesticks can be the tool to get your timing right.
When you expect than an upwards movement will soon weaken and turn around, for example, you can monitor the market for an inverted hammer. As soon as you find it, you invest in falling prices. In this way, you maximize your chances of winning a high/low option and even open the door to the possibility of trading a one touch option.
Conclusions On Candlesticks
Simple candlestick formations can help binary options traders find short-term trading opportunities in any market environment. Even newcomers can quickly learn the skills to interpret simple candlestick formations and invest based on their predictions. We recommend understanding the logic behind candlesticks, most importantly the relationship between body size to wick size and placement, and either trading single candlesticks with short expiries or a combination of candlesticks with a longer expiry.