The Average True Range (ATR) is a technical indicator that can help binary options traders make more money by trading options with higher payouts. This article introduces you to the ATR and the ways in which it can enrich your strategy.
In detail, you will learn:
- What Is The Average True Range (ATR)?
- How Can The Average True Range (ATR) Help Traders?
- Which Limitations Does The ATR Have?
- Three Examples Of The Average True Range (ATR) In Use
With this information, you will immediately be able to enhance your strategy with the ATR and make more money.
What Is The Average True Range (ATR)?
The ATR is a technical indicator. It calculates a simple to interpret value based on past market movements, which allows you to understand what is going on and predict what will happen next.
This approach entirely focuses on price action. It analyzes what happens to the price of an asset to understand how traders feel about this asset.
In the case of the ATR, this approach focuses on the range of a period. The ATR wants to find out how far an average period of an asset has moved in the past.
- The ATR’s value is calculated by subtracting the current period’s low from its high.
- If the previous period closed outside of the current period, the ATR uses the absolute value of the currents period’s high minus the previous period’s close (for rising periods) or the absolute value of the currents period’s low minus the previous period’s close (for falling periods).
In short, the ATR uses one of these four values:
| Rising period | Falling period | |
| Previous close within the range of the current period | ATR = current high – current low | ATR = current high – current low |
| Previous close outside the range of the current period | ATR = current high – previous close | ATR = current low – previous close |
The ATR repeats this calculation for as many periods as you want and then calculates the exponentially smoothed moving average of all results.
If you are looking at an asset with a current value of £100 in a 1-hour chart and the ATR reads 0.2, you know that this asset has moved on average £0.2 up or down over the past periods. This information can help you make better predictions and trade more profitable binary options types.
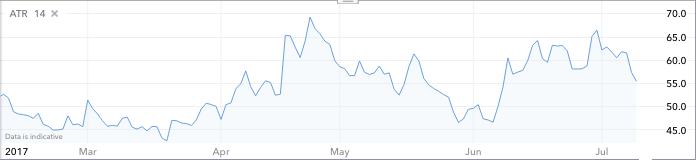
ATR For the FTSE Index:
How Can The Average True Range (ATR) Help Traders?
The ATR is important for binary options traders because it allows them to predict the range of a movement. Without this prediction, you can only invest in high/low options. This option type wins you a trade with any movement in the right direction, even if it is the smallest possible movement. For all other types of binary options, however, you have to predict the distance which the market can move. There is no better tool for this prediction than the ATR.
Let’s take a quick look at all binary options types and let’ see how the ATR can help you:
- One touch options. One touch options define a target price. You have to predict whether the market will move in the right direction and whether it can reach the target price. If it touches the target price, you immediately win your option and get a higher payout than with a high/low option. The ATR can turn a high/low prediction into a one touch prediction by predicting the range of the movement.
- Ladder options. Ladder options work just like high/low options but use a price other than the current market price as their point of reference. With this system, you can get payouts of up to 1,500 percent. The ATR helps you to predict whether the market has enough power to reach these target prices.
- Boundary options. Boundary options define a price channel around the current market price. You win your option when the market leaves this price channel. They work just like a ladder option with two target prices in identical distance of the current market price. The ATR can help you predict whether the market can leave the price channel without requiring an additional prediction. This is the only trading style that allows you to win your option without having to predict the direction in which the market will move – thanks to the ATR.
As you can see from this list, the ATR can help many trades to improve their predictions. Nonetheless, the ATR also has some limitation. Let’s take a closer look at them.
Which Limitations Does The ATR Have?
The ATR can do a lot for you. Like all other indicators, it has limitations, though. When you use the ATR it is important to know these limitations and consider them in your trading. Let’s look at these limitations:
- Range does not equal direction. Even if the ATR has a high value, the market might be unable to move far. When the market lacks direction, alternating upwards and downwards periods might keep the market in position.
- Market environments change. The ATR can only tell you what happened in the recent past. The future might be different, though. Important news can create volatility; the ending trading day can slow things down. In these scenarios, the ATR might not accurately reflect the market’s current reach.
These limitations mean that you are unable to afford to become lazy. Keep an eye on the market, and you should be able to get good predictions from the ATR. In the next part of this article, we present three strategies that can deal with the ATR’s limitations.
3 Examples Trading Strategies Using The Average True Range (ATR)
Let’s take a look at three strategies based on the ATR.
1. Trading boundary options solely based on the ATR
Because boundary options do not require you to predict the direction in which the market will move but only the distance, the ATR is the perfect tool for this type of trading.
All you have to do is compare the ATR’s value to the distance between the boundary option’s target prices and the current market price. Since both target prices are in equal distance from the current market price, this calculation is simple.
For example, assume that you are looking at an asset with a current market price of £100 in a 10-minute price chart. The ATR’s reading is 0.2, and your broker offers you a boundary option with an expiry of one hour and target prices that are £0.5 from the current market price.
Would this boundary option be a good investment? Here’s how you can answer this question:
- Calculate the number of periods until your option expires. Your option expires in one hour, and you are looking at a 10-minute chart. This means that there will be six new periods before your option expires.
- Calculate the market’s maximum reach. The ATR has a value of 0.2. If all six periods before your option expires were pointed in the same direction, the maximum movement would be £1.2.
- Compare the maximum movement to the distance between market price and both target prices. The target prices are £0.5 from the current market price; the maximum reach is £1.2. As we pointed out, you will almost never get a situation in which all periods point in the same direction. But when the maximum movement is 1.4 times as high as the distance between market price and both target prices, there is a very high chance that you will win your option. In this example, most traders would invest.
To simplify comparing the maximum movement to the distance between market price and both target prices, you can use two tricks:
- Define a minimum ratio. Some traders want the maximum movement to exceed the distance between market price and both target price by a fixed factor. With a ratio of 0.5, for example, the maximum movement would have to be at least 1.0 when the distance between market price and both target prices is 0.5. When maximum movement is bigger than 1.0, these traders will If it is smaller, they will stay out of the market.
- Use an indicator to define the ratio. Some indicators measure the market’s strength of direction. The Average Directional Movement Index (ADX), for example, returns a value between 100 (perfect strength of direction) and 0 (no sense of direction). When you divide this value by 100, it provides you with the perfect factor for your strategy. When both target prices are at a distance of 0.5 from the current market price and the ADX reads 0.2, for example, you would only invest when the maximum movement is bigger than 2.5 (0.5 ÷ 0.2 = 2.5).
There are other indicators that can work similarly well as the ADX. The important point is that you use a predefined strategy and not your feelings.
2. Using the ATR to decide whether you trade a high/low option or a one touch option
One touch options and high/low options both have unique advantages. The ATR can help you to decide which type of binary option is right for the current market environment.
- High/low options can win you a trade with the smallest possible movement. But they require you to precisely predict when your prediction will come true. If your prediction comes true too early, you might lose your trade anyway. Additionally, high/low options offer lower payouts than one touch options.
- One touch options allow you to win a trade as long as your prediction comes true at any time before your option expires. They also offer higher payouts than high/low options. But they require a stronger movement.
To know whether the current market is better suited for a high/low option or a boundary option, you have to know whether the market has the power to reach the far away target price of a one touch option. If it has enough energy, it is always better to trade a one touch option because you get a higher payout and the timing is less complicated.
We already explained how to make this prediction with the ATR in the last example. This strategy works in the same way. You predict whether the market will rise or fall, then compare the maximum reach to the distance between the market price and the target price of your one touch option based on a predefined ratio or the ADX.
- If the target price is within range, take the higher payout and invest in a one touch option.
- If the target price is out of range, play it safe and invest in a high/low option.
The way in which you create signals is up to you. You can use this technique to enhance your current strategy.
3. Using the ATR to invest in a ladder option
This strategy is another variation of the ATR in combination with the ADX. Ladder options are a mix of one touch options and high/low options. They offer you five or six target prices, and you can predict whether the price of an asset will be higher or lower than these target prices.
When you predict that the market will trade beyond a faraway target price, you get a high payout. When you predict that the market will trade closer than this target price, you will get a low payout. In this way, ladder options offer you all options, from very secure predictions to highly risky predictions.
Assume for example, than an asset is currently trading for £100. A ladder option offers you a target price of £101 and an expiry of one hour. Now you can predict that the market will gain 1 percent over the next hour – which rarely happens. Consequently, you would get a high payout, somewhere between 500 and 1,500 percent.
You can also predict that the market will trade below £100 in an hour. This is a much more likely prediction, which will result in a lower payout of 20 to 50 percent.
The ATR can help you to predict which prediction you should make. Of course, it would be great to get a payout of 1,500 percent, but if there is no chance that the market will trade above the target price when your option expires, there is no sense in wasting money. It would be better to win the lower payout than to lose the trade.
To predict whether the market can reach the target price, follow these three steps:
- Use a chart that matches your expiry, check the ATR. In our example, the option has an expiry of 60 minutes. Consequently, you would use a one hour chart. Now compare the ATR’s current value to the distance between the market price and the target price of your one touch option. If the ATR’s value is smaller, you can stop right there. The market is highly unlikely to reach the target price, and you are better off investing in the low prediction.
- If the ATR’s reading is bigger than the distance between market price and target price, switch to a shorter time frame and check the ADX. If the ATR indicates that the market could have enough energy to reach the target price, you have to get more accurate. In our example, you would switch to a ten-minute chart and repeat the process that we laid out in our first example. The difference is that you should discount the maximum range more. After all, the market has to remain above the target price, not just reach it. The ADX should diagnose a strong sense of direction for this prediction to be likely, and the ATR should leave enough room for short-term fluctuations.
- Invest according to your prediction. If the ATR and the ADX indicate that the market has a chance of trading above the target price when your option expires, invest in a high ladder option. The high payout means that you can afford to win a lower percentage of your trades, so you can take a few changes. But avoid too risky predictions. Experience will help you find the right balance. If you are unsure, stay out of the market.
Live Chart For Alphabet, Including ATR Indicator Beneath:
Conclusion
These three strategies show how the ATR can enhance your strategy by allowing you to trade investments with a higher payout. Without improving anything else, you can make more money and become a more successful trader.
The important point is to use the ATR to calculate the realistic reach of the market and then discount this value in a realistic way. Also keep an eye out for fundamental influences such as the release of big news or the end of trading day, which can alter the market environment significantly and render the ATR’s value obsolete.