 by Gino D’Alessio
 by Gino D’Alessio
Now that we have the basic concept (read Part 1 here) of Fibonacci numbers we will take a look at how the ratios are used to establish retracement ‘support’ and ‘resistance’ levels.
These primary levels act as both support and resistance. In a bull trend for example; when the trend retraces to the downside each level acts as a support, and when the trend regains its original momentum the level acts as resistance as price trends higher again.
Fibonacci Indicators, Part II; Fibonacci Retracement
To apply Fibonacci Retracements to a chart, we first need to identify the length of the main trend. In the chart below we can see that point A to B shows a significant downward trend on a day chart for the EUR/JPY pair. We can consider this price movement as it has practically no retracements from its downward trend.
The points from A to B represent 100% of the Bear trend we are about to analyse. Point B will give us the 0% line then we divide the space between A and B by drawing lines at 23.6%, 38.2%, 61.8% and 50% which has also been found to be a level at which resistance and support come into play.
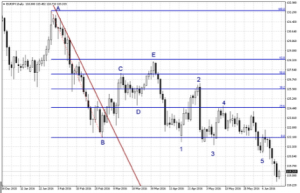
The retracement starts at point B and reaches the 50% resistance level, at point C, before returning to its Bear trend where it found support on the 23.6% line, point D. At this point price regained momentum to the upside, eventually piercing the 50% line but finding resistance, point E, at the 61.8% line.
As the price was unable to regain upward momentum by piercing the 61.8% line, it eventually returned to is downward trend. From point E the price continued to retrace further south and tested the 0% line at points 1, 3 and 5. Once the 0% was broken the value continued its trend lower seeing closes below its most recent lows.
Notice how the price bounced from the 0% line at point 1 and again retraced higher, this time only reaching the resistance of the 38.2%, point 2, where the upward momentum ran out of steam and quickly returned to the downward trend.
The price then tried again to find new highs but failed even to get past the 23.6% line at point 4. It’s easy to see how these levels can act as support and resistance for price retracements, which may also see various attempts to turn a trend around.
The example above gives an illustration of a market where price action has already played out, and in hindsight, you might say it’s easy to draw the lines to suit. However, these retracement lines, thanks to computer software, can be drawn out multiple times. In fact, you will necessarily have to do so as you attempt to mark a turning point in the major trend.
Determining a correction in trend applying Fibonacci
You should be looking for a strong trend to be broken, and new higher highs or lower lows found which run counter to the trend. Fibonacci retracement lines will not work when the market is moving sideways. So it is essential there is a clear and defined trend, the chart below shows what would have happened once a price reached point 1.
There is a strong resistance line which follows that price down from points A to B, the red resistance line in the chart is clearly broken when it reaches point 1. You could already at this point be tempted to draw a retracement line, and you wouldn’t have been wrong.
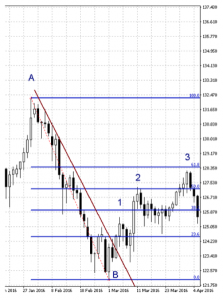
But let’s say you still weren’t convinced, well then it should be fairly evident a retracement has taken place when price reaches point 2. You would then draw the retracement lines using the same points A to B; you will simply have waited longer to find the levels which are most likely to act as support or resistance.
You can see then, that when a clearly defined trend is broken, the retracement lines will remain constant as the price retraces. The Fibonacci lines are placed at specific intervals, so the price tends to move between these levels, rather than the levels move towards the price.
It is also necessary as in all technical indicators to use these lines together with other indicators to create an overlapping effect. These support and resistance levels should also coincide with oversold and overbought indicators such as RSI or Stochastic Oscillators.
Multiple Retracement Lines
The chart below shows how you may have gone through drawing various retracements lines during the Bull rally that takes the WTI Crude Oil from point A to point F. When the price reached point B, you may well have drawn retracement lines. As the price reached a new high and then closed down twice in a row, you may have drawn the retracement lines in red.
The price bounces off the 61.8% line to then close at the 23.6%, it then trends back down again to a new low close to the 0% line at point C. It then begins its bull trend again but finds resistance at the 23.6% line, which is a level it attempts to break several times, without success.
Eventually, that line is broken as so too is the 0%, and price reaches point D. Now you can draw retracement lines from C to D, notice that, on this occasion, the retracement stalls first at the 23.6% level and then regains momentum after nearly reaching the 50% line at point E.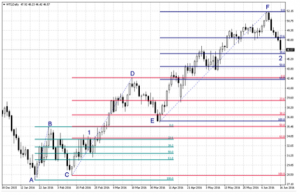
The last line is the one that goes from points E to F; we can see how the price of crude has not found any resistance on the 23.6% line and has got very close to the 38.2% line at point 2.
As this market would seem in a bull trend, it would appear appropriate to initiate longs around the 38.2% unless that level is broken. The next target to the upside for this market is the 23.6% line, as it offered little support on the way down it is probably not going to offer much resistance on the way up. The next resistance level, once the 23.6% line is cleared, will be the 0%.
Overall, Fibonacci Retracement lines do not indicate the main trend nor its strength or momentum. What they do give are good levels for support and resistance when the main trend falters and reverses course. Like all technical indicators, it’s always more effective when used in conjunction with other indicators.